Introduzione
LiDAR (Light Detection and Ranging or Laser Imaging Detection and Ranging) is a remote sensing technique that uses laser pulses to determine the distance of an object. The measurement of the time taken for thousands of emitted light pulses to return to the scanner provides useful information to calculate the distance from the measured object, generating a three-dimensional point cloud (Opitz 2013, 16-17; Lasaponara and Masini 2009, 80; Lasaponara et al . 2010, 155-157; Masini, Coluzzi, and Lasaponara 2011, 263-265; Masini and Lasaponara 2013, 663-664).
Over the years, this technology found several applications in the archaeological field, for some essential reasons. Primarily, any survey processed with this technique is independent of the atmospheric and lighting conditions of the treated scene, overcoming significant limitations inherent in other remote sensing methods. Furthermore, the use of this sensor mounted on a UAV (Unmanned Aerial Vehicle) allows to obtain a high point density, necessary for the detailed restitution of the mapped area with a high spatial resolution that can reach even one or two centimetres. Finally, the ability of the various laser pulses to obtain data through small openings in the vegetation makes it relatively easy to investigate vast areas otherwise hidden by forest cover. It is, in fact, possible to filter, through different algorithms, the point clouds obtained to remove vegetation to highlight the shadow site, whose interpretation is useful to reveal partially buried archaeological emergencies (Sithole and Vosselman 2005, 67-70; Meng, Currit, and Zhao 2010, 840-850; Suleymanoglu and Soycan 2019, 398-400; Buján, Cordero, and Miranda 2020, 155-156; Doneus, Mandlburger, and Doneus 2020, 95-100; Lozić and Štular 2021, 37-40). In particular, this specific characteristic determined a widespread use of the LiDAR data in the study of medieval castles settlements located in hilly or mountainous areas, whose subsequent abandonment, which occurred over the centuries, has determined an abundant growth of trees. In such contexts, where a stratigraphic excavation would encounter significant difficulties and likewise a survey would be strongly limited by poor visibility, LiDAR represents a valid solution for the investigation of archaeological marks. The studies based on the use of LiDAR in this field are increasingly numerous and widespread worldwide, which constitutes a continuous stimulus for the development of research and processing and visualization techniques (Bernardini and Vinci 2020; Risbøl et al . 2020; Menéndez Blanco et al . 2020; Stereńczak et al . 2020; Crabb et al . 2022; 2023; Pețan and Hegyi 2023; Vinci et al . 2024). This paper aims to experiment the use of LiDAR images through a sample case chosen for its characteristics. It is currently abandoned and located in the municipality of Torrecuso (Benevento, Italy), in a low hill area covered by a forest. The area where the site is located is characterised by a tree cover of deciduous oaks and dense undergrowth composed of foliage and various vegetation, which limits visibility and hinders archaeological interpretation. For these reasons, therefore, the area is suitable for the use of LiDAR data and the derived models generated by visualization algorithms, whose interpretation could provide essential information for the identification of shadow site useful for determining the shape of castle. From a methodological point of view, the target is to present the different visualization analyses carried out on the DTM (Digital Terrain Model), aimed at improving visibility and facilitating the interpretation of the archaeological marks and of the geomorphological features. Furthermore, this study aims to evaluate the potential in the historical-topographic field of a specific set of LiDAR data, produced from an authorised aerial survey by law no. 179/2002 (art. 27) and carried out by the Italian Ministry of the Environment ( Ministero dell’ambiente e della tutela del territorio e del mare , MATTM) in agreement with the Ministry of Defense and the Presidency of the Council of Ministers - Department of Civil Protection, as part of the PST-A project (Extraordinary Plan for Environmental Remote Sensing) (Gazzetta Ufficiale n. 189 del 13 agosto 2002. Legge 31 Luglio 2002, n. 179, Disposizioni in materia ambientale, art. 27) and available: http://www.pcn.minambiente.it/viewer/. In Italy, archaeological research based on this specific Airborne Laser Scanning (ALS) dataset is still limited (Fontana 2022; 2024, Corbo 2024). Nevertheless, the availability of such data, largely stemming from periodic surveys promoted by governmental agencies for environmental monitoring and land management, offers highly promising research opportunities. The potential of ALS has already been widely tested in several European countries, such as in the United Kingdom (Challis 2006; Crutchley 2006; Devereux et al . 2005; Challis, Forlin, and Kincey 2011; Johnson and Ouimet 2014; Crabb et al . 2023); in The Netherlands (Van Zijverden and Laan 2003); in Germany (Sittler 2004; Sittler, Siwe, and Gültlinger 2005; Sittler et al . 2007); in France (Mayoral et al . 2017); in Spain (Cerrillo‐Cuenca and Bueno‐Ramírez 2019; Cerrillo-Cuenca and López-López 2020); in Norway (Risbøl, Gjertsen, and Skare 2004); in America (A. F. Chase et al . 2011; 2012; A. Chase et al . 2014; Golden et al . 2016; A. F. Chase and Chase 2017). For a general overview of this topic, see (Vinci et al . 2024). The final phase of the research also included topographical survey, which is necessary in any case for direct verification of the identified proxies (walls, roads, rocks) and confirmation of the archaeological characteristics of the site.Historical and archaeological setting
The target of the research is the medieval Campanian castle of Torre Palazzo, located on the top of a modest hill (200 m above sea level), which rises to the southeast of a deep valley excavated by the Reventa stream and to the west of a bend in the Calore river, where the same stream flows; the site is located at a nodal point between the Benevento plain and the Telesina valley, in an area marked by the middle and lower course of the Calore river (Queirazza et al . 1990, 169; Renda 2010, 110; 2020, 51) 1. Currently, the remains of the castrum are part of a fraction of the municipality of Torrecuso, in the province of Benevento (Figure. 1 A e B).
During the Middle Ages, following the defeat of the Lombards by the Normans, the area, which initially fell within the jurisdiction of the Beneventan principality, was divided. The administration of the new rulers provided for a territorial division into counties: more or less extensive district circles that made up the conquered region (Figliuolo 1991, 41, 53-56; Cuozzo 2006, 285-302; J.-M. Martin 2006, 303-332). During the 12th century, the lower Calore valley, which fell within the southeastern part of the Telesino district, was administered, on behalf of Rainulfo, by some feudal lords who had obtained a portion of the territory (Tescione 1975, 9-10; Cielo 1995, 137) 2. The birth of the fief, while representing an element of institutional novelty within the territory of the county, did not, however, upset its previous territorial arrangements; among these, we know the fief of Ugo Infante II, who administered the barony de Fenuculo . The territory of the new fief had as a reference point the Fenuculus castel, from which the barony probably takes its name, and a series of territoria grouped together to constitute the new institutional reality. Documentary information about the barony is rather scarce, but in a cartula oblationis et confirmationis dated May 1112, its extension and from how many and which castles it was composed are indirectly described (J.-M. Martin et al . 2015, 1576-1578). The document is drawn up by the will of Lord Ugo Infante, who carries out the wishes of his late father, his namesake, lord of Castello Potonis (Castelpoto, BN), who died before he himself could make the donation effective. In the oblatio , as mentioned, reference is made to the territories of the castellum of Toro Helicuso and Turri Palatii (both in the current municipality of Torrecuso, BN) and to the territory of the castellum once called Caprarica . The territoria therefore extended into the lower valley of the Calore river with the castles of Castelpoto, Fenuculus castel, Torrecuso, Paupisi, and Torre Palazzo, and into the Beneventan countryside with the castrum Caprarica . As we read in the 1112 document, the foundation of the castle of Torre Palazzo is certainly to be placed in a period prior, presumably between the 11th and the very early years of the 12th century (Jahn 1989 363-366; G. A. Loud 1991, 364-373; 2000, 256; Canosa 2015, 79), in concomitance with the birth of the fief of Ugo Infante, and would represent the desire for military reorganisation and greater territorial control over the barony (Figliuolo 1991, 55-57). In fact, the determining role of castles in the definition of medieval rural landscapes must be considered, as they, with their strong centralising function, contributed to the formation and consolidation of new demographic nuclei (J.-M. Martin 1993, 301-324; Toubert 1995, 300-315; Settia 1999; Carocci 2010, 265; Rao 2015, 138-141; Augenti 2016, 158-159). In the Chronicon Beneventanum , the castle of Torre Palazzo is mentioned in 1128 during event for retaliation for events that occurred the previous year (D’Angelo 1998). In that year, Ugo Infante, a feudal lord of Count Rainulfo, openly supported his opponent Ruggero II. This provoked the reaction of the count himself who, together with Prince Capuano Roberto and Pope Honorius II, besieged and captured, “ with a large army ”, the castle of Torre Palazzo, forcing Ugo Infante to swear loyalty to Rainulfo (D’Angelo 1998, 100-101). Between the 12th and 13th centuries, the barony de Fenuculo lived a period of relative prosperity, if compared to other centers in the lower Calore valley. In fact, the Catalogus Baronum , from which the patrimonial consistency of the fief administered by Tommaso de Fenuculo , royal judge, can be perceived, records the presence of two milites for the castle of Torre Palazzo and a total of thirty-five knights and twenty-five sergents (Jamison 1972, 176-177; Cuozzo 1984, 278-279). The place occupied by the castrum originally take on a primary role in the capillary control system of the territory, which was completed during the Norman period in the 12th century. Indeed, the castle of Torre Palazzo, located between the Telesina valley (northwest) and Benevento (southeast), dominated the underlying Reventa stream and its natural crossing (ford) or artificial crossing (bridge) (Maio 1995, 21; Cielo 2011, 92; Maio 2012, 77). The area of relevance of the fortified site also extended to the nearby road axis that connected the ancient city of Telese to Benevento ( Telesia-Beneventum ) (Lonardo and Di Cecio 2020, 735). In addition, visibility analysis shows how it was in direct visual connection with the Fenuculus castel (directional center of the aforementioned barony de Fenuculo ), founded a few hundred meters away, on the other side of the Calore river, to control the bridge and the road below. Probably the two castles played a key role in controlling the access routes to the Beneventan plain on one side and to the Telesina valley on the other and were functional to the collection of taxes on pedatico , which represented a substantial income for the economic assets of a lord or feudal lord. Surface surveys carried out in the surrounding of area near the castle seem to testify to the formation, over the years, of a territorium castri : many ceramic fragments have been found a few meters east and north of the site, which attest to a chronological range between the late 8th and early 9th centuries and the 14th century.Description of data
The LiDAR data used, as previously mentioned, are an integral part of the PST-A project, which envisaged the creation of a high-precision Environmental Remote Sensing Plan, aimed at verifying and monitoring areas with high hydrogeological risk (Costabile, Cocco, and Petriglia 2013, 491-494). The main purpose of the project is to monitor hydrography and land management in order to control areas at risk of flooding risk and contain the socio-economic impact of tragic events. Subsequently, the use of the data has been extended to all issues concerning areas of environmental interest.
The first phase of the PST-A was implemented between 2008 and 2009, and flights to acquire LiDAR images were carried out on the main river basins and coastal areas of Italian soil. Between 2010 and 2011, the previously established database was integrated with new acquisitions, and at the same time, the open-source GIS software AdB-Toolbox was developed, equipped with specific tools dedicated to the management and processing of LiDAR data and their derivatives.
The survey carried out has an altimetric accuracy corresponding to +/- 1s (root mean square error), with an error lower than ± 15 cm, while the planimetric accuracy is (̴ 2s), i.e., the error is contained within ± 30 cm, allowing for a rather faithful representation of the morphology of the surveyed territory (Conte, Bonofiglio, and Petriglia 2016, 58-61). The data thus obtained are Digital Terrain Models (DTM) and Surfaces (DSM) with a high level of detail corresponding to two series, one with a resolution of 1x1 m and the other with a resolution of 2x2 m.
Although the original purposes of the project were environmental protection and monitoring, LiDAR data with cells of 1x1 m could be also optimal for identifying archaeological features hidden by tree cover.
Methodology of analysis and visualization techniques
The DTM processed by MATTM presents many distortions due to the filtering algorithms used, which is why it is not useful for archaeological interpretation. Consequently, the point cloud was processed using the LasTools software, trying out different filtering and classification parameters (Lasground and Lasheight classify) to obtain the DTM (las2dem) free of vegetation and the most suitable for archaeological prospection (Fontana 2022).
A series of algorithms were executed with the input of the Digital Terrain Model (DTM) and the filtered point cloud (Figure. 2 A), which produced models with specific visualization characteristics essential for interpreting the archaeological microtopography. For this phase, ArcGIS Pro 3.0.1 and RVT 2.2.1 (Relief Visualization Toolbox) software were used. The objective of developing RVT was to consolidate the greatest number of visualization algorithms in a single software package (Kokalj et al . 2016). The following analyses were carried out: Hillshade (HS); Multi Hillshade (Multi-HS); Principal Component Analysis (PCA); Slope ; Simple Local Relief Model (SLRM); Local Relief Model (LRM); Sky View Factor (SVF); Anisotropic Sky View Factor (ASVF); Openness Positive (OP) and Openness Negative (ON); Sky Illumination Model (SIM); Local Dominance (LD) and Visualization Archaeological Topography (VAT). This number of visualization algorithms was chosen because it was observed that no single technique is able to sufficiently highlight all the archaeological features. Instead, a comprehensive and articulated comparison of multiple elaborations is needed. The data produced was then imported and analysed in GIS system. Subsequently, structures and shadow marks of archaeological interest were manually traced to understand the overlap between automatically obtained features and those optically detected. The following are essential descriptions of the visualization techniques performed and the derived models with the utilised parameters. The Hillshade (HS) is one of the most commonly used techniques for providing an intuitive visualization of topography (Horn 1981, 14-47; Blinn 1977, 192-198; Batson, Edwards, and Eliason 1975, 401-408; Yoëli 1965, 141-148). It consists to illuminate a surface with a direct light source having fixed azimuth and elevation angles for the entire area. Low elevation angles are useful in relatively flat contexts, where the general topography is characterised by slight changes in elevation (Kokalj and Hesse 2017, 16). In the case of Torre Palazzo, after numerous elaborations with different parameters, we chosed to calculate the HS with an elevation angle of 45° and an azimuth of 315, using RVT. The main limitation of HS is hiding archaeological evidence oriented in the same direction as the light beam. Furthermore, especially in hilly areas of medium and high slope, HS produces results in which the illuminated sides are overexposed, while the details of the terrain on the non-illuminated sides are in shadow. A solution proposed by some scholars is to produce multiple HS with different parameters and then compare the results however, this investigative methodology is difficult to apply in the case of multiple archaeological elements close to each other and with different orientations (Crutchley 2006, 251-257; Kokalj, Zakšek, and Oštir 2011, 263-273; Hanus 2012, 233-248; Forlin 2012, 252; Hutson 2015, 259; Devereux, Amable, and Crow 2008, 471-472), and moreover, this practice does not allow for easy interpretation when working on a large area (Crutchley 2006, 23) (Figure. 2 B). Other valid solutions consist of processing Multidirectional Hillshade and Principal Component Analysis . With the Multi-HS algorithm executed with both RVT and ArcGIS Pro tools, leaving the parameters of 45° elevation angle and 315 azimuth unchanged, the light coming from multiple sources is combined for better terrain visualization. The Multi-HS executed with ArcGIS Pro is in grayscale and calculates shading from six different directions, resulting in a more realistic image with balanced overexposed and underexposed areas (Figure. 2 C) . On the other hand, the Multi-HS generated with RVT is viewable as a multiband false-color (RGB) image, but lacks the balance between areas of strong light and shadow, which is useful for archaeological interpretation (Figure. 2 D). The second case, PCA, consists of a multivariate statistical transformation procedure that combines multiple information into a single raster file, facilitating interpretation of the surveyed area (Zavyalov et al . 2009, 55-66; Mather and Koch 2022). The primary function of PCA Hillshading is to group a considerable number of images with limited loss of information since these are typically contained in the first three components, speeding up the interpretation phase considerably (Kokalj and Hesse 2017, 17; Forlin 2012, 257-258) (Figure. 3 A).Slope Analysis (Slope) was also executed with RVT. Slope give a very plastic representation of morphology and highlights changes in the elevations of a particular area; typically, slope calculation is based on a data structure with cells containing altimetric information, evaluating the variation in altitude between a cell and its eight adjacent cells assigns a statistical parameter (Podobnikar 2012, 788; Prufer, Thompson, and Kennett 2015, 9; Larsen et al . 2017, 7-12). Consequently, slope analysis, which returns an output file with average value, could result in a general leveling of the terrain, negatively influencing micro-morphology interpretation (Colecchia and Forlin 2013, 43). Nevertheless, its use is still widespread for predictive models and site location (Opreanu and Lăzărescu 2014, 76). The output file generated is in grayscale but has been reclassified with a color map from green to red to facilitate understanding of terrain elevations (Figure. 3 B). However, the disadvantage of Slope is that positive/convex features (e.g. embankments) and negative/concave features (e.g. ditches) are presented in the same colour, irrespective of rise or fall.
The Local Relief Model (LRM) is a technique that involves filtering the terrain surface to expose only the archaeological features, removing large-scale morphological elements and enhancing small-scale ones, independent of the lighting conditions. The method generally followed was developed by Hesse in a 2010 paper (Hesse 2010). It is a rather simple workflow but involves several steps: applying a low-pass filter to the original DTM, subtracting the smoothed DTM from the original one to preserve only the topographic features at a small scale, applying the “Contour” function, extracting the actual elevation from the original DTM with the “Extract by mask” tool, converting the resulting elevation raster into elevation points with “Raster to Point”, creating a new DTM from the elevation points (“Create TIN” and “TIN to raster function”), and finally subtracting the resulting DTM from the original with the “Minus” function. LRM has excellent potential when used on terrains with gentle and gradual slopes but works less well, producing distortions, where the terrain is steeper, just like the case studied (Kokalj and Hesse 2017, 21). For the case study of Torre Palazzo, the Local Relief Model tool, proposed by Novák and updated to the latest version (Novák 2014), integrated into ArcGIS was used, significantly simplifying the workflow and automatically creating LRM by adjusting only a few parameters (input DEM cell size and the type of low-pass filter to be used). The processing proposed for this study did not involve any changes to the default settings. In addition, the Simple Local Relief Model (SLRM) integrated into the RVT software was also performed. This is a simplified process in which the trend is calculated from a mean filter, and a trend-removed model is produced directly by subtracting the filtered model from the original one. The only parameter to be set is the radius for trend evaluation, which in this case was set to 10 m. The two results intentionally processed with different parameters show some differences due to the trend evaluation radius and the type/size of the low-pass filter kernel, which determines the spatial scale of the features highlighted in LRM. Indeed, in SLRM, the reliefs are highlighted with greater precision and detail (Figure. 3 C - D).Sky View Factor (SVF) algorithm is also useful for overcoming the problems caused by the direction of the light beam in the HS. In fact, through a geophysical parameter, SVF measures the portion of the sky visible from a certain point. It is based on diffuse illumination and returns the scene illuminated by an artificial light coming from the celestial hemisphere (Kokalj, Zakšek, and Oštir 2011, 263-273; Zakšek, Oštir, and Kokalj 2011, 398-415; Kidd and Chapman 2012, 3640-3652). As a result, a ridge appears brighter than the bottom of a valley, because the angle that measures the portion of sky visible from a relief is always greater than that of a valley bottom. Therefore, SVF is particularly effective when applied to hilly or steep areas (Forlin 2012, 262). The calculation of SVF depends on the horizon search radius: the larger the radius, the more general the results, therefore, a small search radius between 5 and 10 meters is necessary for interpreting archaeological features (Colecchia and Forlin 2013, 48-49). Several software programs provide SVF, such as ENVI, LiVT, RVT, and SAGA GIS, however, the latter produces output with highly saturated areas, which is not very useful for details in valleys (Kokalj and Hesse 2017, 22; Magnini, Bettineschi, and De Guio 2017, 213). To enhance the micromorphology of Torre Palazzo, the algorithm integrated in RVT was chosen to use because, unlike that in SAGA GIS, it allows for noise reduction (Level of noise removal: low, medium, or high) in the data, so that the relevant characteristics are more clearly visible. The raster obtained from SVF has values ranging from 0, when sky visibility is obscured, to 1, when visibility is total. For better visualization, the minimum and maximum values of the histogram can be adjusted (Danese et al . 2022, 1593). The parameters we used were a search radius of 5 meters and low noise reduction (Figure. 4 A).
For the processing of the Anisotropic Sky View Factor (ASVF), the RVT algorithm was preferred over SAGA GIS for the same reasons. ASVF does not consider a uniformly lit sky like the SVF, but depends on the azimuth and distance from the light source; therefore, it is similar to HS, but produces sharper images and small features are enhanced even on flat areas (Zakšek et al . 2012, 285-299). ASVF in RVT assumes some parameters to be adjusted such as the level (low or high), and the direction of anisotropy by setting the azimuth; in the following study, a low anisotropic level and an azimuth of 315° was used (Figure. 4 B). Openness is a visualization mode of topography that expresses the positive or negative domain of a particular area (Yokoyama, Shirasawa, and Pike 2002, 257). To determine the openness value, all pixels of a raster are calculated from eight fixed viewpoints (N, NE, E, SE, S, SO, O, NO) with different zenith or nadir angles within a specified search radius. Openness Positive (OP) considers a perspective above the DEM surface (convex shapes), equal to the average value of zenith angles, and Openness Negative (ON), below the DEM surface (concave shapes), equal to the average value of all nadir angles (Doneus 2013, 6428-6429; Danese et al . 2022, 1592). The main difference with SVF is that Openness considers the entire sphere, not just the celestial hemisphere, so the maximum value can exceed 90°, and the output is a flat image, that is more difficult to interpret, but the local terrain features are more pronounced (Zakšek, Oštir, and Kokalj 2011, 403-404; Kokalj and Hesse 2017, 27; Masini et al . 2018, 10). The processing of PO and NO was carried out using RVT software, with the same SVF values (Figure. 4 C - D).Local Dominance (LD) determines how much each pixel “dominates” locally what surrounds it: the brightness of each pixel corresponds to the average angle at which an observer looks at the surrounding surface (Kokalj and Hesse 2017, 25; Hesse 2016, 116). LD is very useful for highlighting features in flat or slightly inclined areas, for these reasons it did not produce excellent results, having been used on a hilly terrain with the Southeast slope characterised by a steep incline. In RVT, the parameters to be adjusted concern the minimum and maximum radius within which to consider the calculation; for the case of Torre Palazzo, the values were set at 5-5 m (Figure. 5 A ).
The Sky Illumination Model (SIM) consists of a uniformly distributed light source that illuminates a surface (Kennelly and Stewart 2006, 21-36). In RVT, the overcast and uniform parameters are implemented, as both neglect shading effects. Overcast was chosen for the Torre Palazzo study, which produced a plastic and three-dimensional-looking raster where the micromorphology is well highlighted. The number of sampling points was left at 250, while the maximum shadow modeling distance was lowered to 50 (Challis, Forlin, and Kincey 2011, 281; Kennelly and Stewart 2014, 384-406) (Figure. 5 B).Visualization for Archaeological Topography (VAT), is a visualization technique created for archaeological purposes and implemented in RVT ( Kokalj and Somrak 2019; Verbovšek, Popit, and Kokalj 2019, 2951-2953). It consists of the fusion of several images with the aim of improving the visibility of small topographic features. The combination involves the HS or Multi HS (viewable in RGB, equally the final product will be viewable in false colours) as a base layer to which the Slope is added with the aim of conferring greater three-dimensionality (the blending mode is luminosity, with opacity at 50% and the min and max values are between 0 and 60 since the area of interest is on very steep terrain). Next, Openness Positive (OP) is added in overlay as the third layer, with 50% opacity and 70-95 as min and max values. The last layer in multiply mode with 25% opacity was SVF, with 0.60-1 min and max; these two are important for emphasising small-scale structures and are also complementary in that OP shows depressions as dark and exposed area as bright, as opposed to SVF (Fontana 2022) (Figure. 5 C - D).
Results and discussion
The comparative analysis of DTM visualization elaborations streamlined the processes of knowledge of the medieval site of Torre Palazzo, highlighting some significant marks of micro-topographic reliefs linked to archaeological and geomorphological elements of the area (Fig. 1.C-D).
Thanks to subsequent autopsy investigations, it was possible to recognise the emphasised elements detected by visualization analyses and subsequently attribute them to the archaeological features present in the area. However, the presence of deciduous oak trees and the abundant underbrush composed of foliage, but also brambles, represented, in some cases, an insurmountable obstacle for the investigation of archaeological elements that are currently mostly covered. In any case, the data from derived models have allowed the identification of large stretches of masonry structures, highlighting the iconographic articulation of a castle-tower (definition also based on Norman era documents). From the verification in situ of such data, it seems possible to identify the central nucleus of a fortified structure, perhaps a keep (Figure. 6 A e B), positioned in the northern corner of a small polygonal-shaped wall enclosure (Figure. 6 C e D; Figure. 7; Figure. 8 A - B). The latter is slightly shifted against the northern portion of the curtain wall of a second outer circuit, which adapts to the rocky conformation of the soil and extends southeast, following the natural orography of the place (Figure. 8 C - D; Figure. 9 A). Only the eastern section and part of the western section of this second wall enclosure have been traced; the rest appears collapsed or inaccessible, unlike the inner enclosure, which appears more preserved. The masonry technique consists of opus incertum and in opus caementicium , with abundant mortar, blocks, and shards of stonework (Crova 2005, 87-89, 94-95, 104-106; Frisetti 2020, 164-165). The curtain walls feature a limestone apparatus composed of rough-hewn blocks, sometimes also coarsely and summarily worked with imperfectly squared cuts and varying dimensions, arranged in a cursive manner, as perceived from the irregular courses with stone flakes closing the cavities (Crova 2005, 124-127) (Figure. 9 C). In some parts of the internal wall circuit the foundations are visible and are with direct attachment to the limestone rock (Figure. 9 B). Furthermore, it is to be hypothesised that there is a concrete possibility of using diversified materials, not only stone but also wood, now disappeared, which certainly constituted a fundamental component in Norman constructions (Coppola 2015, 191-194). The type of keep with a double wall circuit, internal and external, was functional for the defense and control of a certain area with significantly reduced construction costs and times, just like the case in question. The castrum of Torre Palazzo, due to its building technique, seems to represent an example of Norman military architecture referring to the 12th century, strongly serialised and elementary (Coppola 2005, 40). These characteristics find parallels with contemporary nearby settlements, such as the Torre Palazzo castle and the Ferrarisi tower, indicating a common building strategy and territorial arrangement in the analysed context (Lonardo and Di Cecio 2020, 784-785) Furthermore, it certainly played a relevant role within the barony de Fenuculo , being located in a strategic position to control the road network and the underlying crossing over the Reventa stream. In fact, following the Norman conquest, castles and fortified towers became typical elements of the countryside of the Calore valley and were used to control the territory. The real advantage is the speed with which they are erected and, in addition, they offer protection and security to all those living nearby. In general, however, the results obtained from the processing of derived models appear quite satisfactory, limited only by the definition of the 1x1 m cells of the input DTM, and led to the detailed detection of surface relief and elevation variations related to both geomorphological and archaeological features. Most of the findings show elements attributable to the remains of a castle-tower, with an outer wall and a second internal one. Other marks are recognisable to the south, such as paths and roads or other less-deep micro-reliefs located to the right of the site, which could refer to potential structures or habitation buildings. The interpretation of these marks is less clear due to poor visibility, but the hypothesis of the presence of a settlement is certainly justified by the large amount of medieval pottery found in the surrounding ploughed lands and by the reading of medieval documents, especially the one from 1221 previously considered. In any case, the visualization techniques that contain the most detail are SVF, ASVF, OP and HS-VAT, which overcome the limitations due to illumination direction typical of HS or Multi-HS (Crabb et al . 2023, 6-7). Concerning the external wall circuit, a small interruption of the defensive structure can be traced, possibly due to a collapse (remains of small and medium-sized rough-hewn blocks were found in large quantities all along the western hillside). On the south side of the west wall, the collapse can be precisely identified (Fig. 1.C-D, n. 3; Fig. 6.C-D), which is not sufficiently represented in other visualization techniques. In addition, can be seen very precisely the pseudo-curvilinear course of the south south-west corner (Fig. 1.C-D, nn. 5-6; Fig. 7.C), that is directly on the rock, marked by a darker tone. Similarly, the contrast between black and lighter pixels helps to clearly highlight the north-east corner (Fig. 1.C-D, nn. 7-8; Fig. 8.A-B). It is possible to identify the remains of another wall section to the south; also built on the rock (Fig. 1.C-D, n. 11; Fig. 9.A), but whose function can only be defined with certainty after an excavation. It is likely that between the first and second walled circuit there were buildings or accessory structures made of perishable material (e.g. wood) and therefore no longer preserved, in fact, a mild slope, which could indicate the presence of buried structures, can be seen especially in the Slope, but also in the Multi-HS, MultiHS-VAT, SIM, LD. Finally, on the northern aspect of the hill a sheer rock face is observable (Figure. 10, n. 12). The morphological characteristics appear consistent with an artificial cut undertaken to enhance the settlement’s defensive potential and to increase the difficulty of access to the most exposed section of the defensive circuit. The shaping of the rock (red calcareous flysch), cut at the base of the walls, may also have permitted the in situ extraction of building material for the castle. The extraction of material in situ, where feasible, was a common practice dictated by temporal constraints; it also allowed the procurement and on-site working of stone at relatively low cost (Coppola 2015, 149–150).Conclusion
The great potential of airborne LiDAR sensors (ALS) to emit multiple laser pulses and record more than a single return is crucial for the investigation of high-altitude or mid-hill sites. For this case, only two return signals (First and Last) were recorded, nonetheless under certain conditions of arboreal vegetation (as for the site investigated, that is characterised by small and medium-sized oaks) the laser can pass through the canopy gap and return a sufficient number of points to be able to process the DTM.
The results obtained show how this type of data can be used for the detection and interpretation of microtopographical features of an archaeological nature. In fact, the MATTM’s LiDAR was fundamental for the study of the medieval site of Torre Palazzo (for which few written sources are available), overcoming the limitations of optical sensors (such as aerial and satellite images and survey methodologies based on photogrammetry and aerophotointerpretation). The processing of the different visualisation algorithms, integrated and compared in order to obtain maximum information, also made it possible to identify the most useful analyses (Slope, SVF, ASVF, OP and VAT) for identifying surface discontinuities and emphasising traces and anomalies, which were then interpreted as pertaining to archaeological elements of the Torre Palazzo castle. Field verification of the obtained results through on-site surveys is crucial for attributing with certainty the highlighted marks to anthropic elements. Furthermore, it is important to set, where possible, the various parameters of the algorithms according to the specific characteristics of the terrain to be examined and empirically evaluate those parameters that seem to be most suitable to output derived models capable of maximise archaeological features.
The difficulty highlighted is the scale ratio, in fact that does not exceed 100 square meters overall. In fact, LiDAR data with 1x1 m cells only allow for the detection of elements of a meter or more and do not record other small height differences that smaller archaeological remains may produce. However, the present work, despite these limitations of spatial resolution, shows how it was possible to extract the main archaeological features of the Torre Palazzo fortification, allowing a hypothetical reconstruction of the structure’s form and the identification of its constituent elements.
Footnotes
- The area is locally known by the microtoponyms ‘Castello’, ‘Castellone’, ‘I palazzi’.
- Founded shortly after 1062 and administered by Rainulfo I, then, in 1087 to Roberto I and later, in 1116 to Rainulfo II.
References
- Augenti, A. 2016. Archeologia dell’Italia medievale. Bari: Laterza.
- Batson, R. M., K. Edwards and E.M. Eliason. 1975. “Computer Generated Shaded Relief Images”. in Journal of Research of the U.S. Geological Survey 3 (4): 401-8
- Bernardini, F., and G. Vinci. 2020. “Archaeological Landscape in Central Northern Istria (Croatia) Revealed by Airborne LiDAR: From Prehistoric Sites to Roman Centuriation”, in Archaeological and Anthropological Sciences 12 (7): 133. https://doi.org/10.1007/s12520-020-01070-w
- Blinn, J.F. 1977. “Models of Light Reflection for Computer Synthesized Pictures”, in SIGGRAPH Computer Graphics 11 (2): 192-8.
- Buján, S., M. Cordero and D. Miranda. 2020 “Hybrid overlap filter for LiDAR point clouds using free software”, in Remote Sensing 12 (7): 1051-79. https://doi.org/10.3390/rs12071051
- Canosa, R. 2015. “La conseguenze della conquista normanna in Italia: il titolo comitale negli antichi principati longobardi”, in Bulletino dell’Istituto Storico Italiano per il Medio Evo 117: 67-101.
- Carocci, S. 2010. “Archeologia e mondi rurali dopo il Mille: uno sguardo dalle fonti scritte”. Archeologia Medievale 37: 259-66.
- Cerrillo‐Cuenca, E., and P. Bueno‐Ramírez. 2019. “Counting with the invisible record? The role of LiDAR in the interpretation of megalithic landscapes in south‐western Iberia (Extremadura, Alentejo and Beira Baixa)”, in Archaeological Prospection 26 (3): 251-64. https://doi.org/10.1002/arp.1738
- Cerrillo-Cuenca, E., and A. López-López. 2020. “Evaluación y Perspectivas Del Uso Del LiDAR En La Arqueología Española”, in Boletín del Museo Arqueológico Nacional 39: 221–38
- Challis, K. 2006. “Airborne Laser Altimetry in Alluviated Landscapes.” in Archaeological Prospection 13 (2): 103–27. https://doi.org/10.1002/arp.272
- Challis, K., P. Forlin, and M. Kincey. 2011. “A Generic Toolkit for the Visualization of Archaeological Features on Airborne LiDAR Elevation Data”, in Archaeological Prospection 18 (4): 279–89. https://doi.org/10.1002/arp.421
- Chase, A., D. Chase, J. Awe, J. Weishampel, G. Iannone, H. Moyes, J. Yaeger, et al. 2014. “Ancient Maya Regional Settlement and Inter-Site Analysis: The 2013 West-Central Belize LiDAR Survey”, in Remote Sensing 6 (9): 8671–95. https://doi.org/10.3390/rs6098671
- Chase, A., D. Chase, A. F. Chase. 2017. “LiDAR for Archaeological Research and the Study of Historical Landscapes.” in Sensing the Past. Geotechnologies and the Environment, vol 16, edited by N. Masini, and F. Soldovieri, 89-100. Springer. https://doi.org/10.1007/978-3-319-50518-3_4
- Chase, A. F., D. Z. Chase, C. T. Fisher, S. J. Leisz, and J. F. Weishampel. 2012. “Geospatial Revolution and Remote Sensing LiDAR in Mesoamerican Archaeology”, in Proceedings of the National Academy of Sciences 109 (32): 12916–21. https://doi.org/10.1073/pnas.1205198109
- Chase, A. F., D. Z. Chase, J. F. Weishampel, J. B. Drake, R. L. Shrestha, K. C. Slatton, J. J. Awe, and W. E. Carter. 2011. “Airborne LiDAR, Archaeology, and the Ancient Maya Landscape at Caracol, Belize”, in Journal of Archaeological Science 38 (2): 387–98. https://doi.org/10.1016/j.jas.2010.09.018
- Cielo, R.L. 1995. L’abbaziale normanna di S. Salvatore de Telesia. Napoli: Edizioni Scientifiche Italiane.
- Cielo, R.L. 2011. “Dipendenze dell’abbazia cistercense di S. Maria della Ferraria nel territorio beneventano: Santo Spirito di Orcoli”, in Forme e storia. Scritti per Francesco Gandolfo, edited by W. Angelelli and F. Pomarici, 315-24. Roma.
- Colecchia, A., and P. Forlin. 2013 “Visibilità e interpretazione del record archeologico in aree d’altura: le potenzialità dell’analisi del LiDAR DTM”, in APSAT 2: Paesaggi d’altura nel Trentino: evoluzione naturale e aspetti culturali. (Progetti di archeologia), edited by D.E. Angelucci, 41-60. Mantova: SAP-Società Archeologica.
- Conte A., M.P. Bonofigli, L. Petriglia. 2016 “Il Geoportale Nazionale: un’infrastruttura a supporto delle emergenze”, in GEOmedia 20, (5): 58-61.
- Coppola, G. 2005. L’architettura Dell’Italia Meridionale in Età Normanna (Secoli XI-XII). Mezzogiorno e Mediterraneo 3. Napoli: Artemisia Comunicazione.
- Coppola, G. 2015. “L’edilizia nel Medioevo.” Roma: Carocci editore.
- Corbo, A. 2024, “Airborne LiDAR Applications at the Medieval Site of Castel Fenuculus in the Lower Valley of the Calore River (Benevento, Southern Italy)”, in Land 13 (12), 2255. https://doi.org/10.3390/land13122255
- Costabile, S., S. Cocco, L. Petriglia. 2013. “Il nuovo Piano Straordinario di Telerilevamento Ambientale: esempio di sinergia tra amministrazione centrale e amministrazione locale”, in Atti 17a Conferenza Nazionale ASITA - Riva del Garda 5-7 novembre 2013, edited by ASITA. 491-4.
- Crabb, N., C. Carey, A. J. Howard, and M. Brolly. 2023. “Lidar Visualization Techniques for the Construction of Geoarchaeological Deposit Models: An Overview and Evaluation in Alluvial Environments”, in Geoarchaeology 38 (4): 420–44. https://doi.org/10.1002/gea.21959
- Crabb, N., C. Carey, A. J. Howard, R. Jackson, N. Burnside, and M. Brolly. 2022. “Modelling Geoarchaeological Resources in Temperate Alluvial Environments: The Capability of Higher Resolution Satellite Remote Sensing Techniques”, in Journal of Archaeological Science 141 (5): 105576. https://doi.org/10.1016/j.jas.2022.105576
- Crova, C. 2005. “Insediamenti e tecniche costruttive medievali. Il Latium adiectum e la Terra Laboris.” Montecassino: Arti Grafiche Caramanica.
- Crutchley, S. 2006. “Light detection and ranging (lidar) in the Witham Valley, Lincolnshire: an assessment of new remote sensing techniques”, in Archaeological Prospection 13 (4): 251-7. https://doi.org/10.1002/arp.294
- Crutchley, S., and P. Crow. 2010. The Light Fantastic: Using airborne lidar in archaeological survey. Swindon: English Heritage Publishing.
- Cuozzo, E. 1984. Catalogus Baronum. Commentario. Roma: Istituto Storico Italiano per il Medio Evo.
- Cuozzo, E. 2006. “Le istituzioni politico-amministrative legate alla conquista. Le ripartizioni territoriali: i comitati.” I caratteri originari della conquista normanna: diversità e identità nel Mezzogiorno, 1030-1130: atti delle sedicesime Giornate normanno-sveve, Bari, 5-8 ottobre 2004. 16, edited by R. Licinio and F. Violante, 285-302. Bari: Edizioni Dedalo.
- Danese, M., D. Gioia, V. Vitale, N. Abate, A. Minervino Amodio, R. Lasaponara and N. Masini. 2022. “Pattern Recognition Approach and LiDAR for the Analysis and Mapping of Archaeological Looting: Application to an Etruscan Site”, in Remote Sensing 14 (7): 1587-605. https://doi.org/10.3390/rs14071587
- D’Angelo, E. 1998. Chronicon Beneventanum. Città e feudi dei Normanni di Falcone di Benevento. Firenze: SISMEL edizioni del Galluzzo.
- Devereux, B.J., G.S. Amable, and P. Crow, and A. D. Cliff. 2005. “The potential of airborne lidar for detection of archaeological features under woodland canopies”, in Antiquity, 79 (305): 648-60. https://doi.org/10.1017/S0003598X00114589
- Devereux, B.J., G.S. Amable, and P. Crow. 2008. “Visualisation of LiDAR terrain models for archaeological feature detection” in Antiquity 82 (316): 470-79. https://doi.org/10.1017/S0003598X00096952
- Doneus, M. 2013. “Openness as visualization technique for interpretative mapping of airborne lidar derived digital terrain models”, in Remote sensing 5 (12): 6427-42. https://doi.org/10.3390/rs5126427
- Doneus, M, G. Mandlburger and N. Doneus. 2020. “Archaeological ground point filtering of airborne laser scan derived point-clouds in a difficult mediterranean environment”, in Journal of Computer Applications in Archaeology 3 (1): 92-108. https://doi.org/10.5334/jcaa.44
- Figliuolo, B. 1991. “Morfologia dell’insediamento nell’Italia meridionale in età normanna.” In Studi Storici 32 (1): 25-68.
- Fontana, G. 2022. “Italy’s Hidden Hillforts: A Large-Scale Lidar-Based Mapping of Samnium”, in Journal of Field Archaeology 47 (4): 245-61. https://doi.org/10.1080/00934690.2022.2031465
- Fontana, G. 2024. “Issues of Sampling and Representativeness in Large‐Scale LiDAR‐Derived Archaeological Surveys in Mediterranean Contexts.” in Archaeological Prospection 32 (1): 103-117. https://doi.org/10.1002/arp.1951
- Forlin, P. 2012. “Airborne LiDAR data analysis within the Alpine landscapes of Trentino: a methodological approach”, in Post Classical Archaeologies 2: 247-68.
- Frisetti, A. 2020. La Valle Del Volturno Nel Medioevo: Paesaggio, Insediamenti e Cantieri. Cerro al Volturno: Studi Vulturnensi.
- Golden, C., T. Murtha, B. Cook, D. S. Shaffer, W. Schroder, E. J. Hermitt, O. Alcover Firpi, and A. K. Scherer. 2016. “Reanalyzing Environmental Lidar Data for Archaeology: Mesoamerican Applications and Implications”, in Journal of Archaeological Science: Reports 9: 293–308. https://doi.org/10.1016/j.jasrep.2016.07.029
- Hanus, K. 2012. “The applications of airborne laser scanning in archaeology”, in Studies in Ancient Art and Civilization 16: 233-8.
- Hesse, R. 2010. “LiDAR-Derived Local Relief Models - a New Tool for Archaeological Prospection”, in Archaeological Prospection 17 (2): 67–72.
- Hesse, R. 2016. “Visualisierung hochauflösender Digitaler Geländemodelle mit LiVT”, in Computeranwendungen und Quantitative Methoden in der Archäologie. 4. Workshop der AG CAA 2013, edited by U. Lieberwirth and I. Herzog, Edition Topoi, 109-28. Berlin Studies of the Ancient World. Berlin: Topoi.
- Horn, Berthold K.P. 1981. “Hill Shading and the Reflectance Map”, in Proceedings of the IEEE 69 (1): 14-47.
- Hutson, Scott R. 2015. “Adapting LiDAR data for regional variation in the tropics: A case study from the Northern Maya Lowlands”, in Journal of Archaeological Science: Reports 4: 252-63.
- Jahn, W. 1989. “Untersuchungen zur normannischen Herrschaft in Süditalien (1040-1100)”. Frankfurt 1989.
- Jamison, E. 1972. Catalogus Baronum. Roma: Istituto Storico Italiano per il Medio Evo.
- Johnson, K. M., and W. B. Ouimet. 2014. “Rediscovering the Lost Archaeological Landscape of Southern New England Using Airborne Light Detection and Ranging (LiDAR)”, in Journal of Archaeological Science 43: 9–20. https://doi.org/10.1016/j.jas.2013.12.004
- Kennelly, P.J., and J.A. Stewart. 2006. “A uniform sky illumination model to enhance shading of terrain and urban areas”, in Cartography and Geographic Information Science 33 (1): 21-36.
- Kennelly, P.J., and A.J. Stewart. 2014. “General sky models for illuminating terrains”, in International Journal of Geographical Information Science 28 (2): 383-406.
- Kidd, C., and L. Chapman. 2012. “Derivation of sky-view factors from lidar data”, in International journal of remote sensing 33 (11): 3640-52. https://doi.org/10.1080/01431161.2011.635163
- Kokalj, Ž., and R. Hesse. 2017. Airborne laser scanning raster data visualization: a guide to good practice. Založba ZRC: Institute of Anthropological and Spatial Studies, ZRC SAZU, 2017.
- Kokalj Ž. and M. Somrak. 2019. “Why Not a Single Image Combining Visualizations to Facilitate Fieldwork and On-Screen Mapping”, in Remote Sensing 11 (7): 747-73. https://doi.org/10.3390/rs11070747
- Kokalj, Ž., K. Zakšek, and K. Oštir. 2011. “Application of sky-view factor for the visualisation of historic landscape features in lidar-derived relief models”, in Antiquity 85 (327): 263-73.
- Kokalj, Ž., K. Zakšek, K. Oštir, P. Pehani, K. Čotar and M. Somrak. 2016. “Relief Visualization Toolbox, Ver. 2.2.1 Manual”, in Remote Sensing 3 (2): 398-415.
- Larsen, B.P., S.J. Holdaway, P.C. Fanning, T. Mackrell, and J.I. Shiner. 2017. “Shape as an outcome of formation history: Terrestrial Laser Scanning of shell mounds from far north Queensland, Australia”, in Quaternary International 427: 5-12. https://doi.org/10.1016/j.quaint.2015.06.066
- Lasaponara, R. and N. Masini. 2009. “Full-waveform Airborne Laser Scanning for the detection of medieval archaeological microtopographic relief”, in Journal of Cultural Heritage 10 (1): 78-82. https://doi.org/10.1016/j.culher.2009.10.004
- Lasaponara, R., R. Coluzzi, F.T. Gizzi, and N. Masini. 2010 “On the LiDAR contribution for the archaeological and geomorphological study of a deserted medieval village in Southern Italy”, in Journal of Geophysics and Engineering 7 (2): 155-63. https://doi.org/10.1088/1742-2132/7/2/S01
- Lonardo, L. and Di Cecio, M.T. 2020. Ricerche a Cerreto Sannita (2012-15) e archeologia dei paesaggi dal Titerno alla bassa valle del Calore. Bari: Edipuglia.
- Loud, G.A. 1991. “The Medieval Records of the Monastery of St Sophia, Benevento”, in Archives 19 (86): 364-73.
- Loud, G.A. 2000. “A Lombard abbey in a Norman world: St Sophia, Benevento, 1050-1200.” In Montecassino and Benevento in the middle ages Essays in South Italian Church History, edited by G.A. Loud. Singapore: Routledge.
- Lozić, E., and B. Štular. 2021. “Documentation of archaeology-specific workflow for airborne LiDAR data processing”, in Geosciences 11 (1): 26-51 https://doi.org/10.3390/geosciences11010026
- Magnini, L., C. Bettineschi, and A. De Guio. 2017. “Object‐based shell craters classification from LiDAR‐derived sky‐view factor”, in Archaeological Prospection 24 (3): 211-23. https://doi.org/10.1002/arp.1565
- Maio, L. 1995. “La battaglia di Manfredi e la fine del dominio svevo nel territorio beneventano”, in Rivista storica del Sannio 4, pp. 5-29.
- Maio, L. 2012. Storia di Castelpoto (dalle origini al sec. XVII). Benevento
- Martin, M.J. 1993. La Pouille du VIe au XIIe siècle. Roma: École Française de Rome.
- Martin, M.J. 2006. “Le institutions politico-administratives liéès à la conquete. Le duché”, in I caratteri originari della conquista normanna: diversità e identità nel Mezzogiorno, 1030-1130: atti delle sedicesime Giornate normanno-sveve, Bari, 5-8 ottobre 2004. 16, edited by R. Licinio and F. Violante, pp. 285- 302. Bari: Edizioni Dedalo.
- Martin, M.J., E. Cuozzo, L. Feller, G. Orofino, A. Thomas, M. Villani. 2015. Registrum Petri Diaconi:(Montecassino, archivio dell’abbazia, reg. 3): Roma: École Française de Rome.
- Masini, N., R. Coluzzi, and R. Lasaponara. 2011. “On the airborne Lidar contribution in archaeology: from site identification to landscape investigation”, in Laser scanning, theory and applications, edited by C.-C. Wang, 263-90. IntechOpen
- Masini, N., and R. Lasaponara. 2013. “Airborne Lidar in Archaeology: Overview and a Case Study”, in Computational Science and Its Applications – ICCSA 2013, edited by B. Murgante, S. Misra, M. Carlini, C.M. Torre, H.-Q. Nguyen, D. Taniar, B.O. Apduhan, and O. Gervasi, 7972: 663–76. Lecture Notes in Computer Science. Berlin, Heidelberg: Springer Berlin Heidelberg. https://doi.org/10.1007/978-3-642-39643-4_48
- Masini, N., F. Terenzio Gizzi, M. Biscione, V.Fundone, M. Sedile, M. Sileo, A. Pecci, B. Lacovara and R. Lasaponara. 2018. “Medieval archaeology under the canopy with lidar. the (re)discovery of a medieval fortified settlement in southern Italy”, in Remote Sensing 10 (10): 1598-624. https://doi.org/10.3390/rs10101598
- Mather, P.M. 2004. Computer Processing of Remotely-Sensed Images An Introduction. 3rd Edition. New York: Wiley.
- Mayoral, A., J.P. Toumazet, S. François-Xavier, F. Vautier and J.L. Peiry. 2017. “The highest gradient model: a new method for analytical assessment of the efficiency of LiDAR-derived visualization techniques for landform detection and mapping”, in Remote Sensing 9 (2): 120-43. https://doi.org/10.3390/rs9020120
- Menéndez Blanco, A., J. G. Sánchez, J. M. Costa-García, J. Fonte, D. González-Álvarez, and V. V. García. 2020. “Following the Roman Army between the Southern Foothills of the Cantabrian Mountains and the Northern Plains of Castile and León (North of Spain): Archaeological Applications of Remote Sensing and Geospatial Tools”, in Geosciences 10 (12): 485. https://doi.org/10.3390/geosciences10120485
- Meng, X., N. Currit and K. Zhao. 2010. “Ground filtering algorithms for airborne LiDAR data: A review of critical issues”, in Remote Sensing 2 (3): 833-60. https://doi.org/10.3390/rs2030833
- Novák D. 2014, Local Relief Model (LRM) Toolbox for ArcGIS. https://doi.org/10.13140/rg.2.1.2010.1201/1
- Opitz, R. S. 2013. “An Overview of Airborne and Terrestrial Laser Scanning in Archaeology”, in Interpreting Archaeological Topography: Airborne Laser Scanning, 3D Data and Ground Observation. Occasional Publication of the Aerial Archaeology Research Group, no. 5. Oxford, UK Oakville, Conn: Oxbow Books David Brown Book Co.
- Opreanu, H.C., V.A. Lăzărescu, A. Roman, U. Tudor-Mihai and S. Fărcaş. 2014. “New light on a Roman fort based on a Lidar survey in the forested lansdcape from Porolissum”, in Ephemeris Napocensis 24: 71-86.
- Pețan, A., and A. Hegyi. 2023. “Freely Available LiDAR-Derived Digital Terrain Model (DTM) Uncovers the Heartland of the Dacian Kingdom”, in Digital Applications in Archaeology and Cultural Heritage 31: 292-300. https://doi.org/10.1016/j.daach.2023.e00292
- Podobnikar, T. 2012. “Detecting Mountain Peaks and Delineating Their Shapes Using Digital Elevation Models, Remote Sensing and Geographic Information Systems Using Autometric Methodological Procedures”, in Remote Sensing 4:784-809. https://doi.org/10.3390/rs4030784
- Prufer, K.M., A.E. Thompson, and D.J. Kennett. 2015. “Evaluating Airborne LiDAR for Detecting Settlements and Modified Landscapes in Disturbed Tropical Environments at Uxbenká, Belize”, in Journal of Archaeological Science 57: 1-13. http://dx.doi.org/10.1016/j.jas.2015.02.013
- Queirazza, G.C., C. Marcato, G.B. Pellegrini, and G. Petracco Sicar. 1990. Dizionario di toponomastica. Storia e significato dei nomi geografici italiani. Milano: Garzanti Editore.
- Rao, R. 2015. I paesaggi dell’Italia medievale. Roma: Carocci editore.
- Renda, G. 2010. “La zona dal torrente Titerno al Fiume Calore”, in Atlante tematico di topografia antica: supplementi: XV, 4, 2010, Roma: L’Erma di Bretschneider.
- Renda, G. 2020. “Carta archeologica e ricerche in Campania, Fascicolo 11: Comuni di Cerreto Sannita, Guardia Sanframondi, San Lorenzello”, in Atlante tematico di topografia antica: supplementi: XV, 11, 2020, Roma: L’Erma di Bretschneider.
- Risbøl, O., A. Kristian Gjertsen and K. Skare. 2006. “Airborne laser scanning of cultural remains in forests: some preliminary results from a Norwegian project”, in Bar International Series 1568: 107-13.
- Risbøl, O., D. Langhammer, E. Schlosser Mauritsen, and O. Seitsonen. 2020. “Employment, Utilization, and Development of Airborne Laser Scanning in Fenno-Scandinavian Archaeology—A Review”, in Remote Sensing 12 (9): 1411. https://doi.org/10.3390/rs12091411
- Settia, A.A. 2011. Proteggere e dominare: fortificazioni e popolamento nell’Italia medievale. Roma: Viella.
- Sithole, G. and G. Vosselman. 2005. “Filtering of airborne laser scanner data based on segmented point clouds.” International Archives of Photogrammetry, Remote Sensing and Spatial Information Sciences 36 (3): 66-71.
- Sittler, B. 2004. “Revealing historical landscapes by using airborne laser scanning.” Laser-Scanners for Forest and Landscape Assessment: 258-61.
- Sittler, B., R. Siwe, and M. Gültlinger. 2005. “Airborne Laser Scanning as a New Remote Sensing Tool for Assessing Historic Landscapes. Generation of a Digital Elevation Model of Ridge and Furrow Fossilized under a Forest near Rastatt (Germany).” In Aerial Photography and Archaeology, edited by J. Bourgeois and M. Meganck, 213-19. Ghent: Academia Press.
- Sittler, B., H. Weinacker, M. Gültlinger and L. Koupaliantz. 2007. “The potential of Lidar in assessing elements of cultural heritage hidden under forests”, in New developments and challenges in remote sensing Proceedings of the 26th Annual Symposium of the European Association of Remote Sensing Laboratories EARSeL, Warsaw, Poland, edited by Z. Bochenek, 539-48. Rotterdam: Millpress
- Stereńczak, K., R. Zapłata, J. Wójcik, B. Kraszewski, M. Mielcarek, K. Mitelsztedt, M. Białczak, et al. 2020. “ALS-Based Detection of Past Human Activities in the Białowieża Forest—New Evidence of Unknown Remains of Past Agricultural Systems”, in Remote Sensing 12 (16): 2657. https://doi.org/10.3390/rs12162657
- Süleymanoğlu, B., and M. Soycan. 2019. “Comparison of filtering algorithms used for DTM production from airborne lidar data: A case study in Bergama, Turkey”, in Geodetski Vestnik 63 (3): 395-414. https://doi.org/10.15292/geodetski-vestnik.2019.03.395-414
- Tescione, G. 1975. “Roberto conte normanno di Alife, Caiazzo e S. Agata dei Goti”, in Archivio storico di Terra di Lavoro 4: 9-52.
- Toubert, P. 1995. Della terra ai castelli. Paesaggio, agricoltura e poteri nell’Italia medievale. Roma: Einaudi.
- Van Zijverden, W.K. and W.N.H. Laan. 2003. “Landscape reconstructions and predictive modeling in archaeological research, using a LiDAR based DEM and digital boring databases”, in Workshop Archäologie und computer 9.
- Verbovšek T., T. Popit, Ž. Kokalj. 2019. “VAT Method for Visualization of Mass Movement Features: An Alternative to Hillshaded DEM”, in Remote Sensing 11, 2946-59. https://doi:10.3390/rs11242946
- Vinci G., F. Vanzani, A. Fontana, and S. Campana 2024. “LiDAR Application in Archaeology: A Systematic Review” in Archaeological Prospection 32 (1): 81-101. https://doi.org/10.1002/arp.1931
- Yoëli, P. 1965. “Analytische Schattierung. Ein Kartographischer Entwurf.” Kartographische Nachrichten 15 (5): 141-8.
- Yokoyama R., M. Shirasawa, and R.J. Pike. 2002. “Visualizing topography by openness: A new application of image processing to digital elevation models”, in Photogrammetric engineering and remote sensing 68 (3): 257-66.
- Zakšek K., K. Oštir, and Ž. Kokalj. 2011. “Sky-view factor as a relief visualization technique”, in Remote sensing 3 (2): 398-415. https://doi.org/10.3390/rs3020398
- Zavyalov V.V., G.E. Bingham, M.D. Wojcik. 2009. “Application of principal component analysis to lidar data filtering and analysis”, in Lidar Technologies, Techniques, and Measurements for Atmospheric Remote Sensing 5 (7479), edited by U.N. Singh and G. Pappalardo, 55-66. SPIE https://doi.org/10.1117/12.830126
-
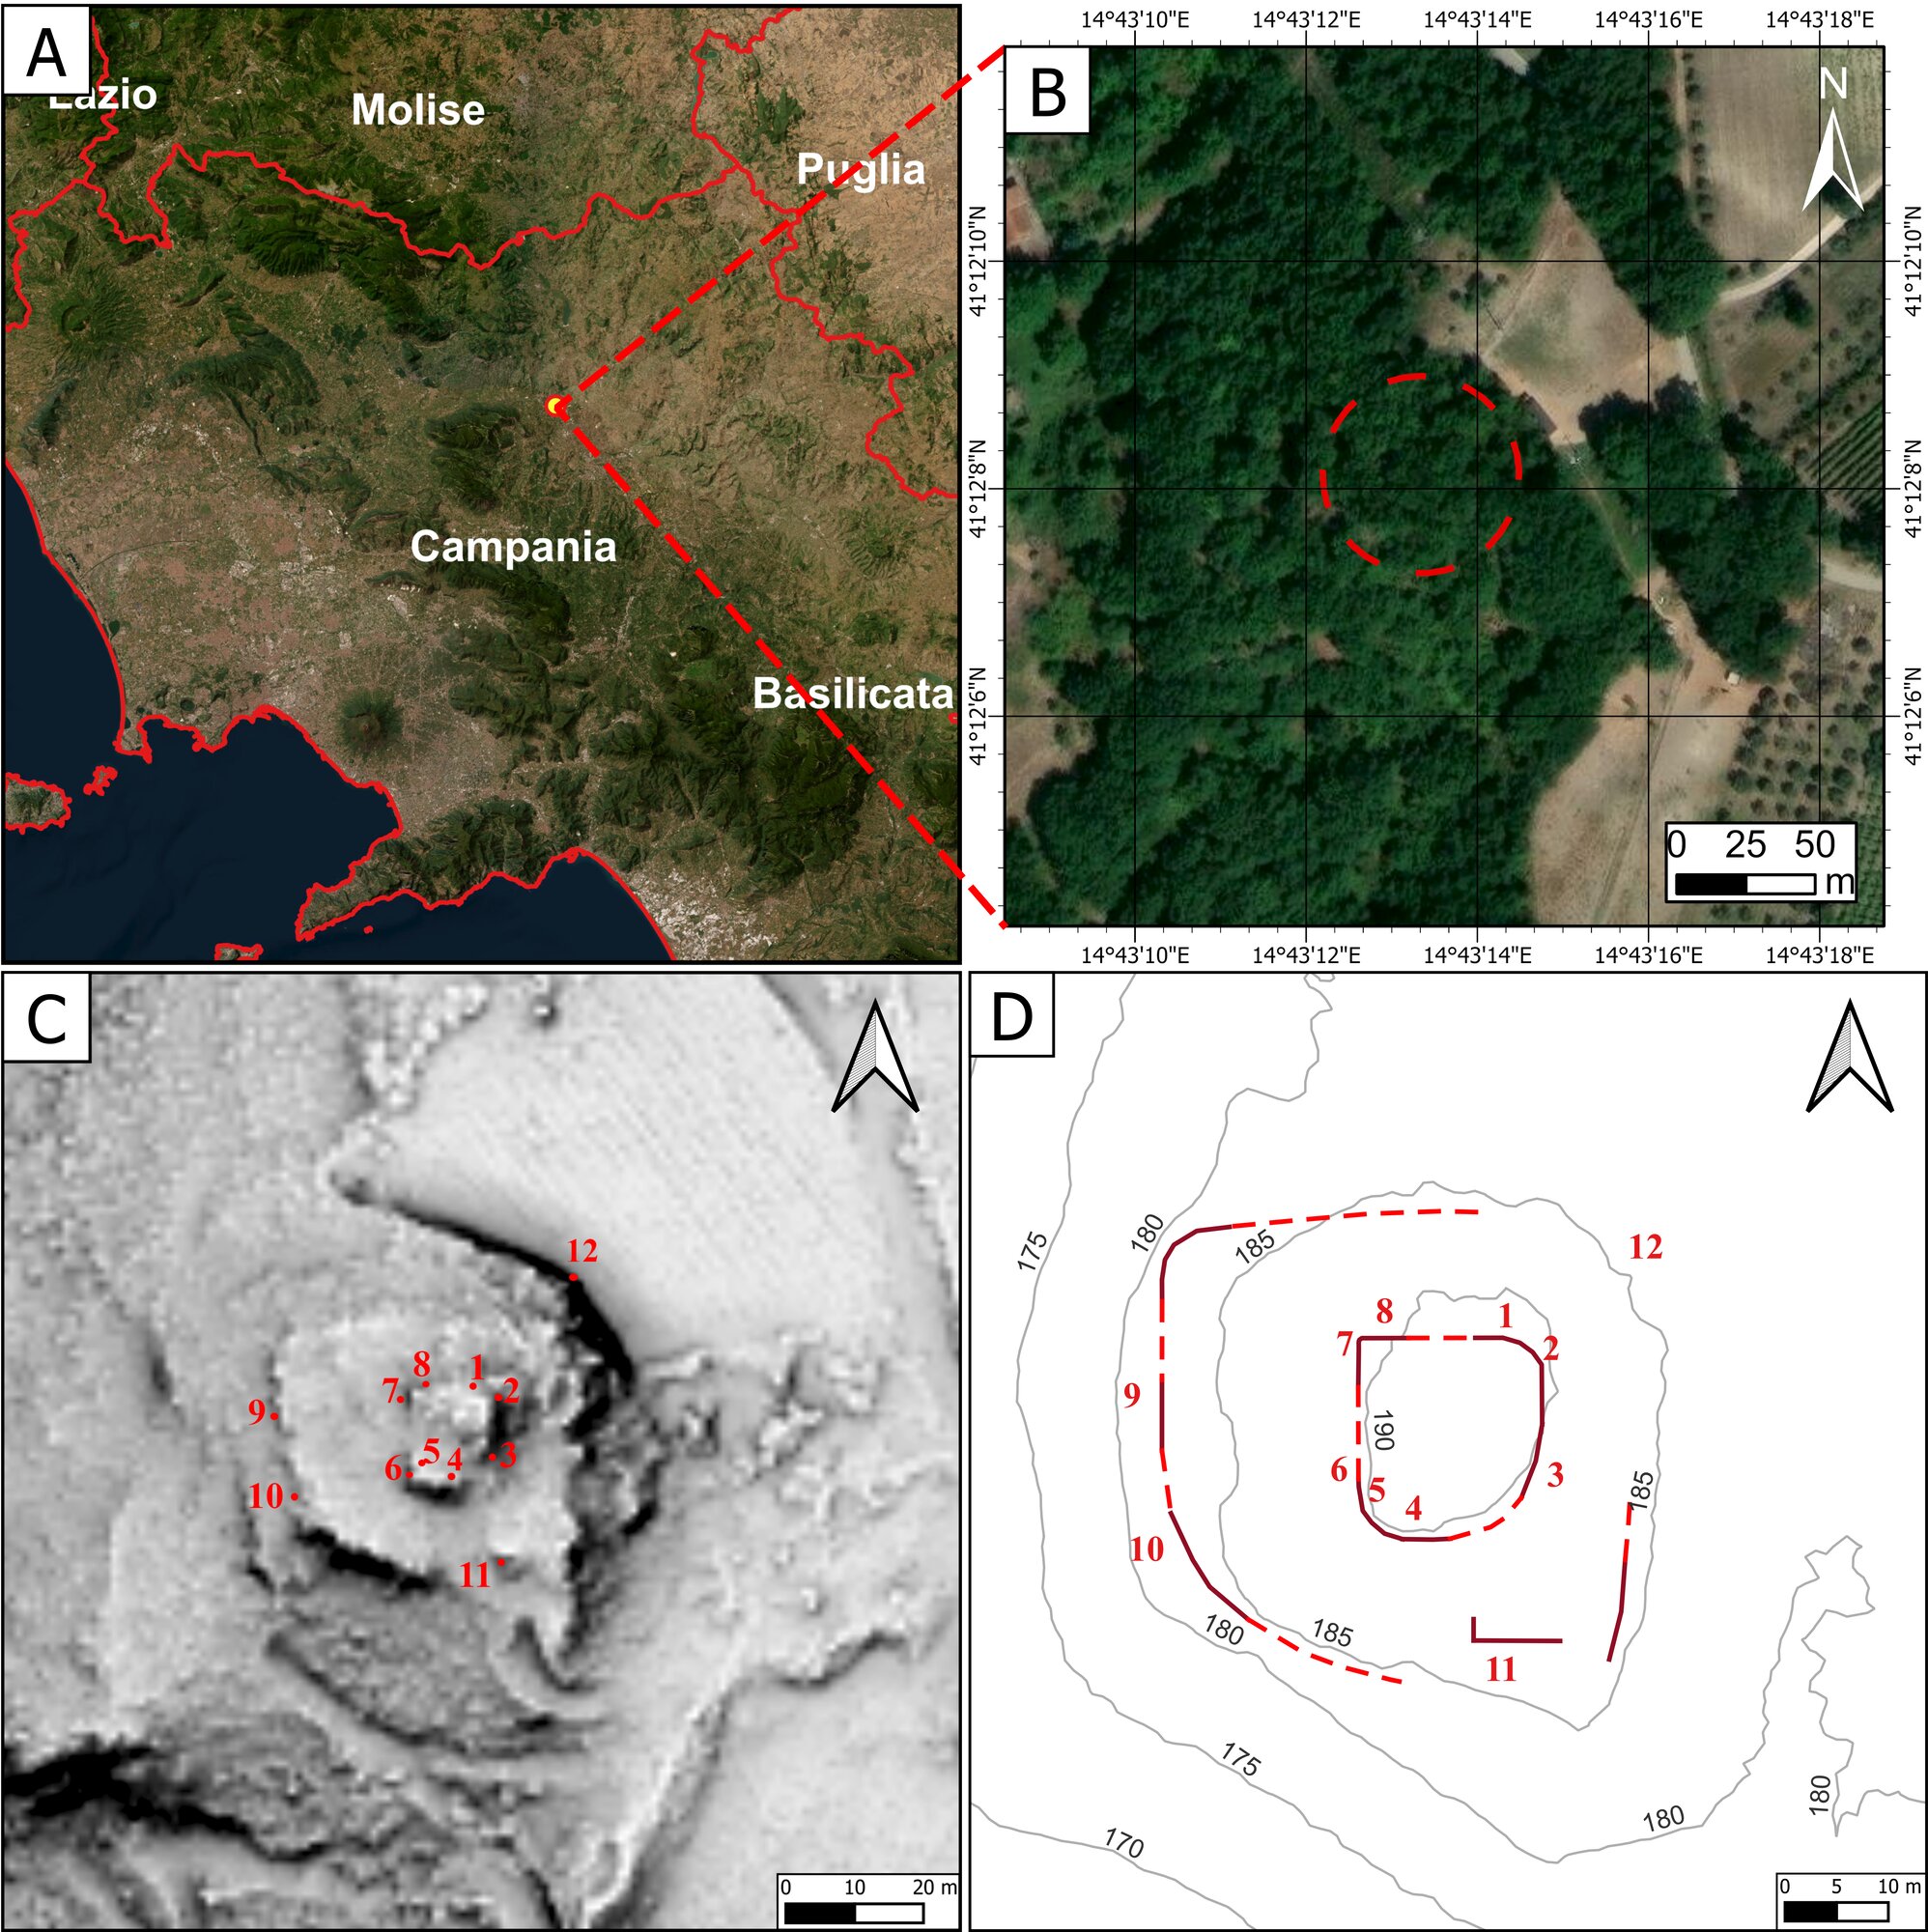 Figure 1 - A-B. Topographic overview of the study area; C. Orthophoto with the investigated area delimited in red; D. Visualization for Archaeological Topography (VAT) map with numerical indication of the plots where field inspections were carried out and mapping of the archaeological elements based on the indications obtained from all the derived models created. (nn. 1-3=figure 6; nn. 4-6=figure 7; nn. 7-10 8=figure 8; n. 11=figure 9. A; n. 12=figure 10.)
 -
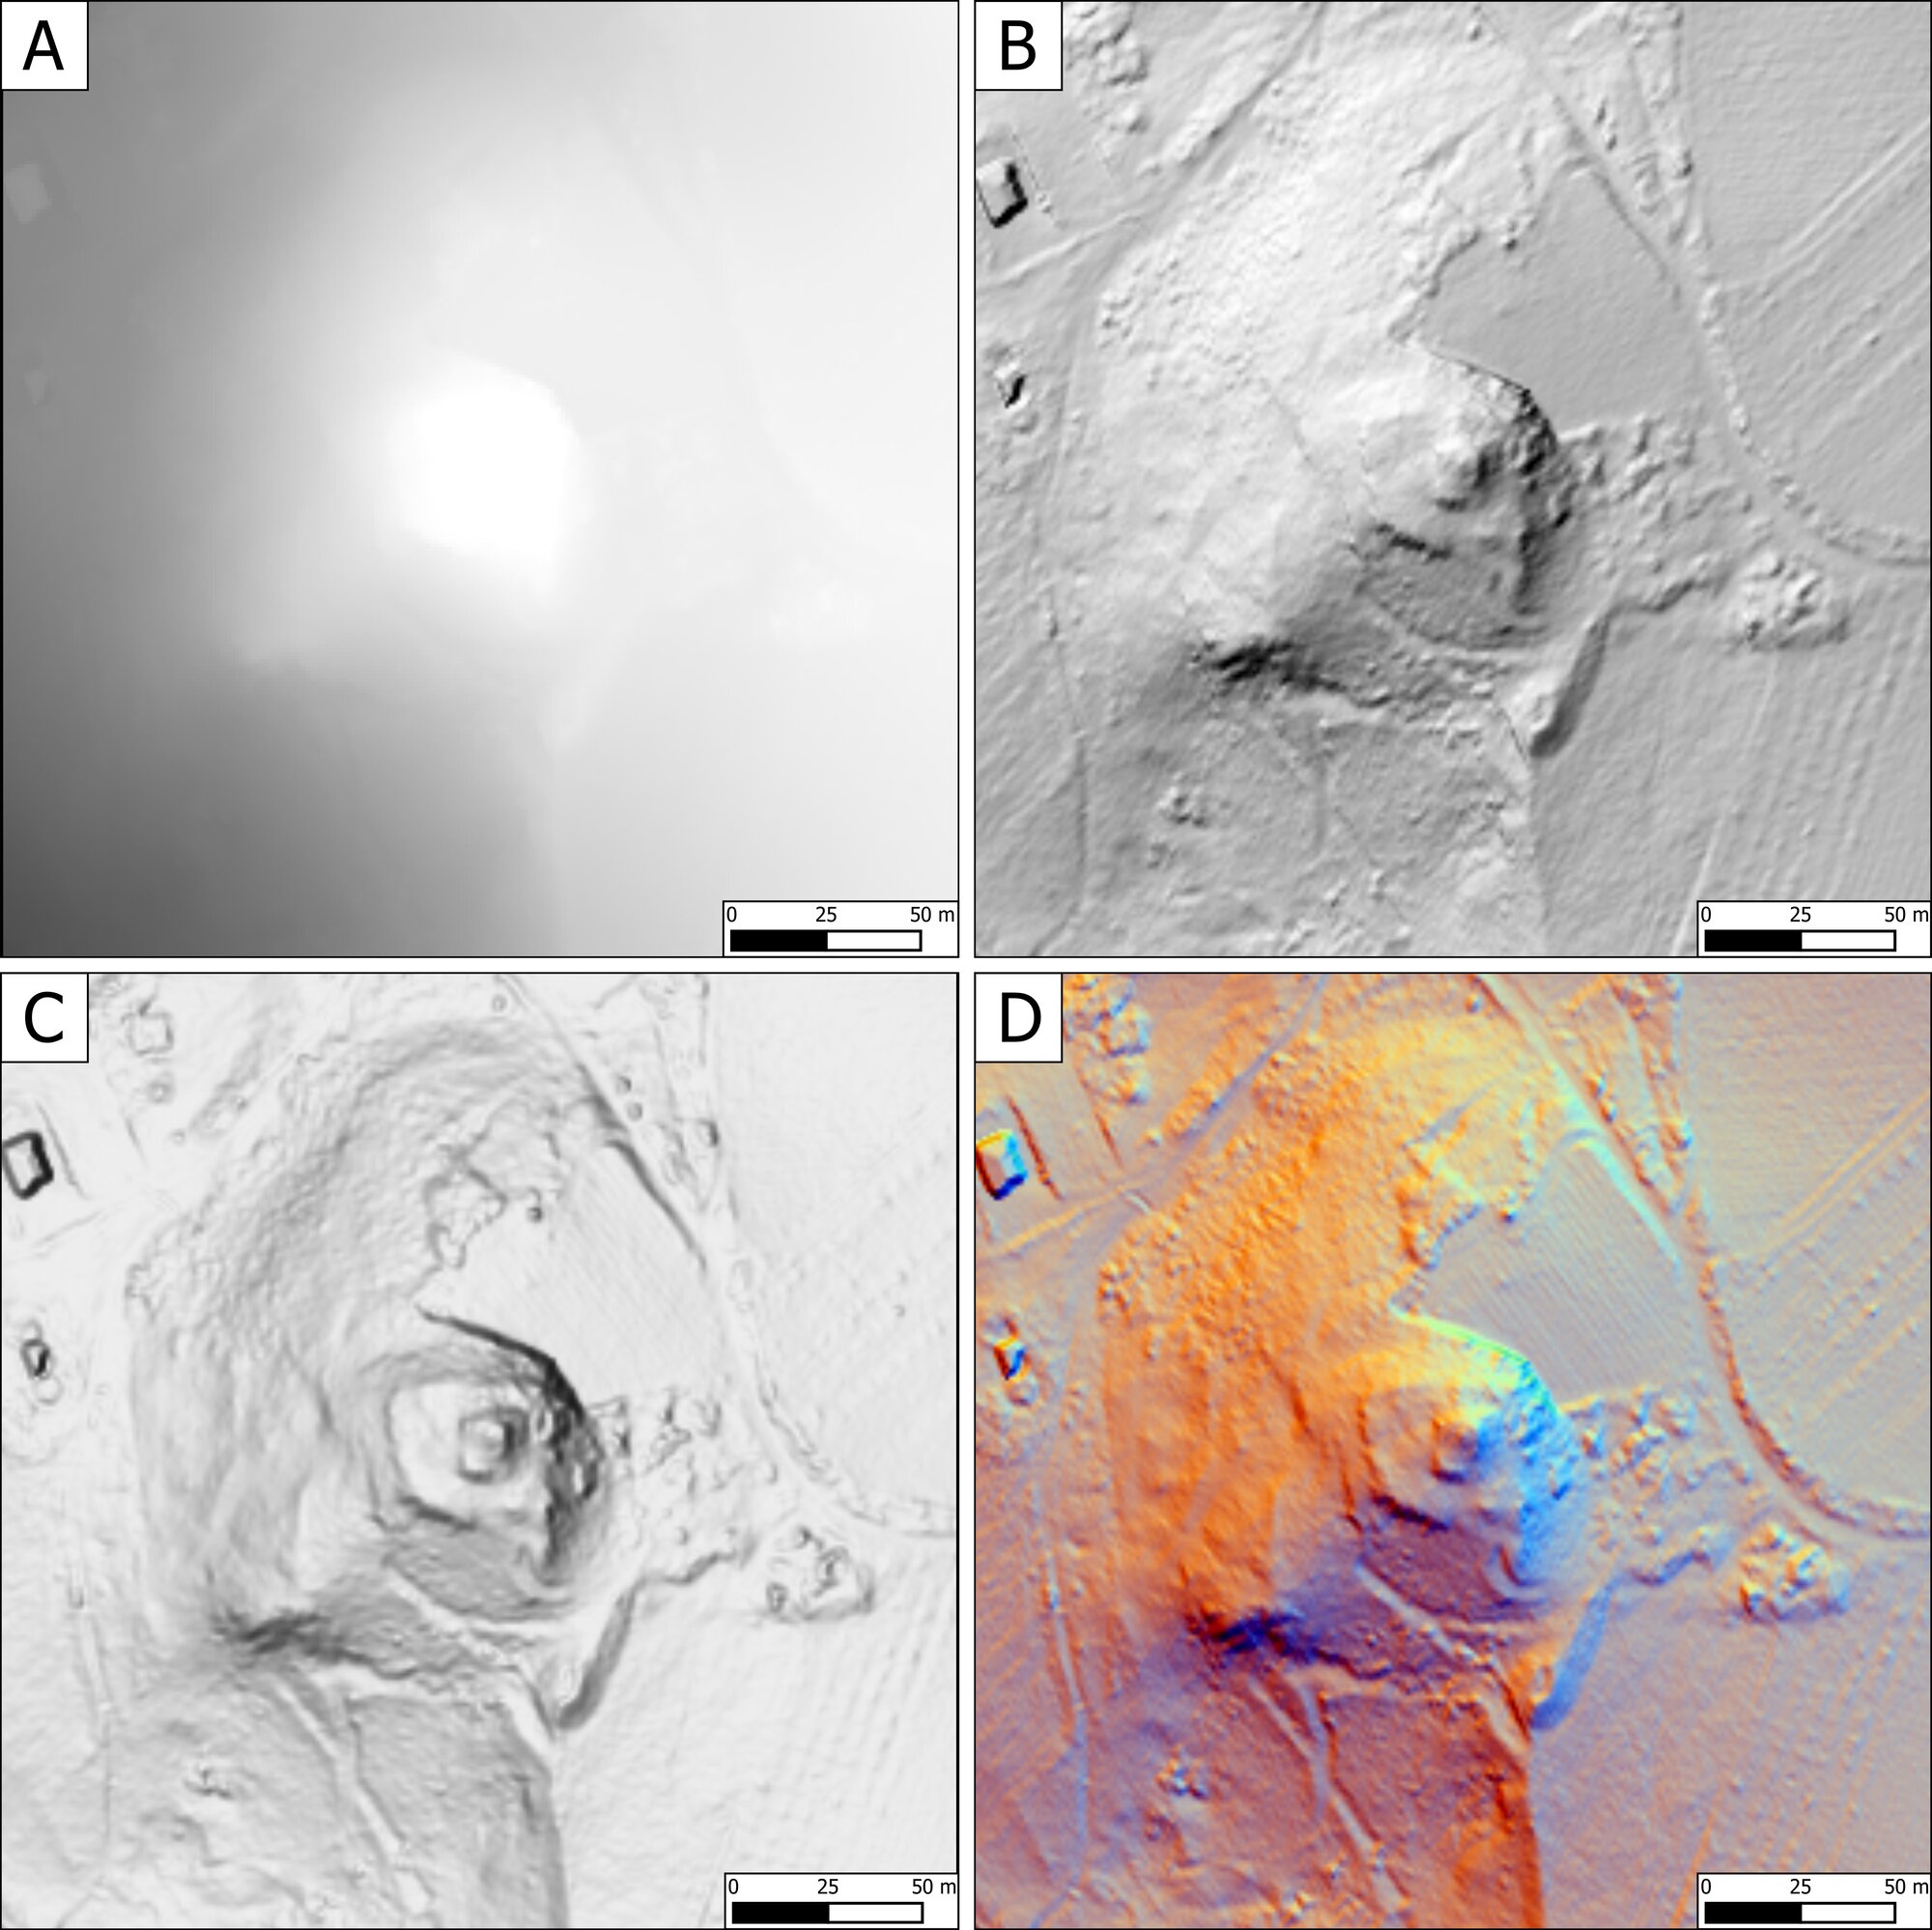 Figure 2 - A. DTM processed with LAStools; B. HS processed in RVT; C. Mutli-HS processed with the Hillshade function (Multidirectional) tool di ArcGIS Pro; D. Multi-HS processed in RVT.
 -
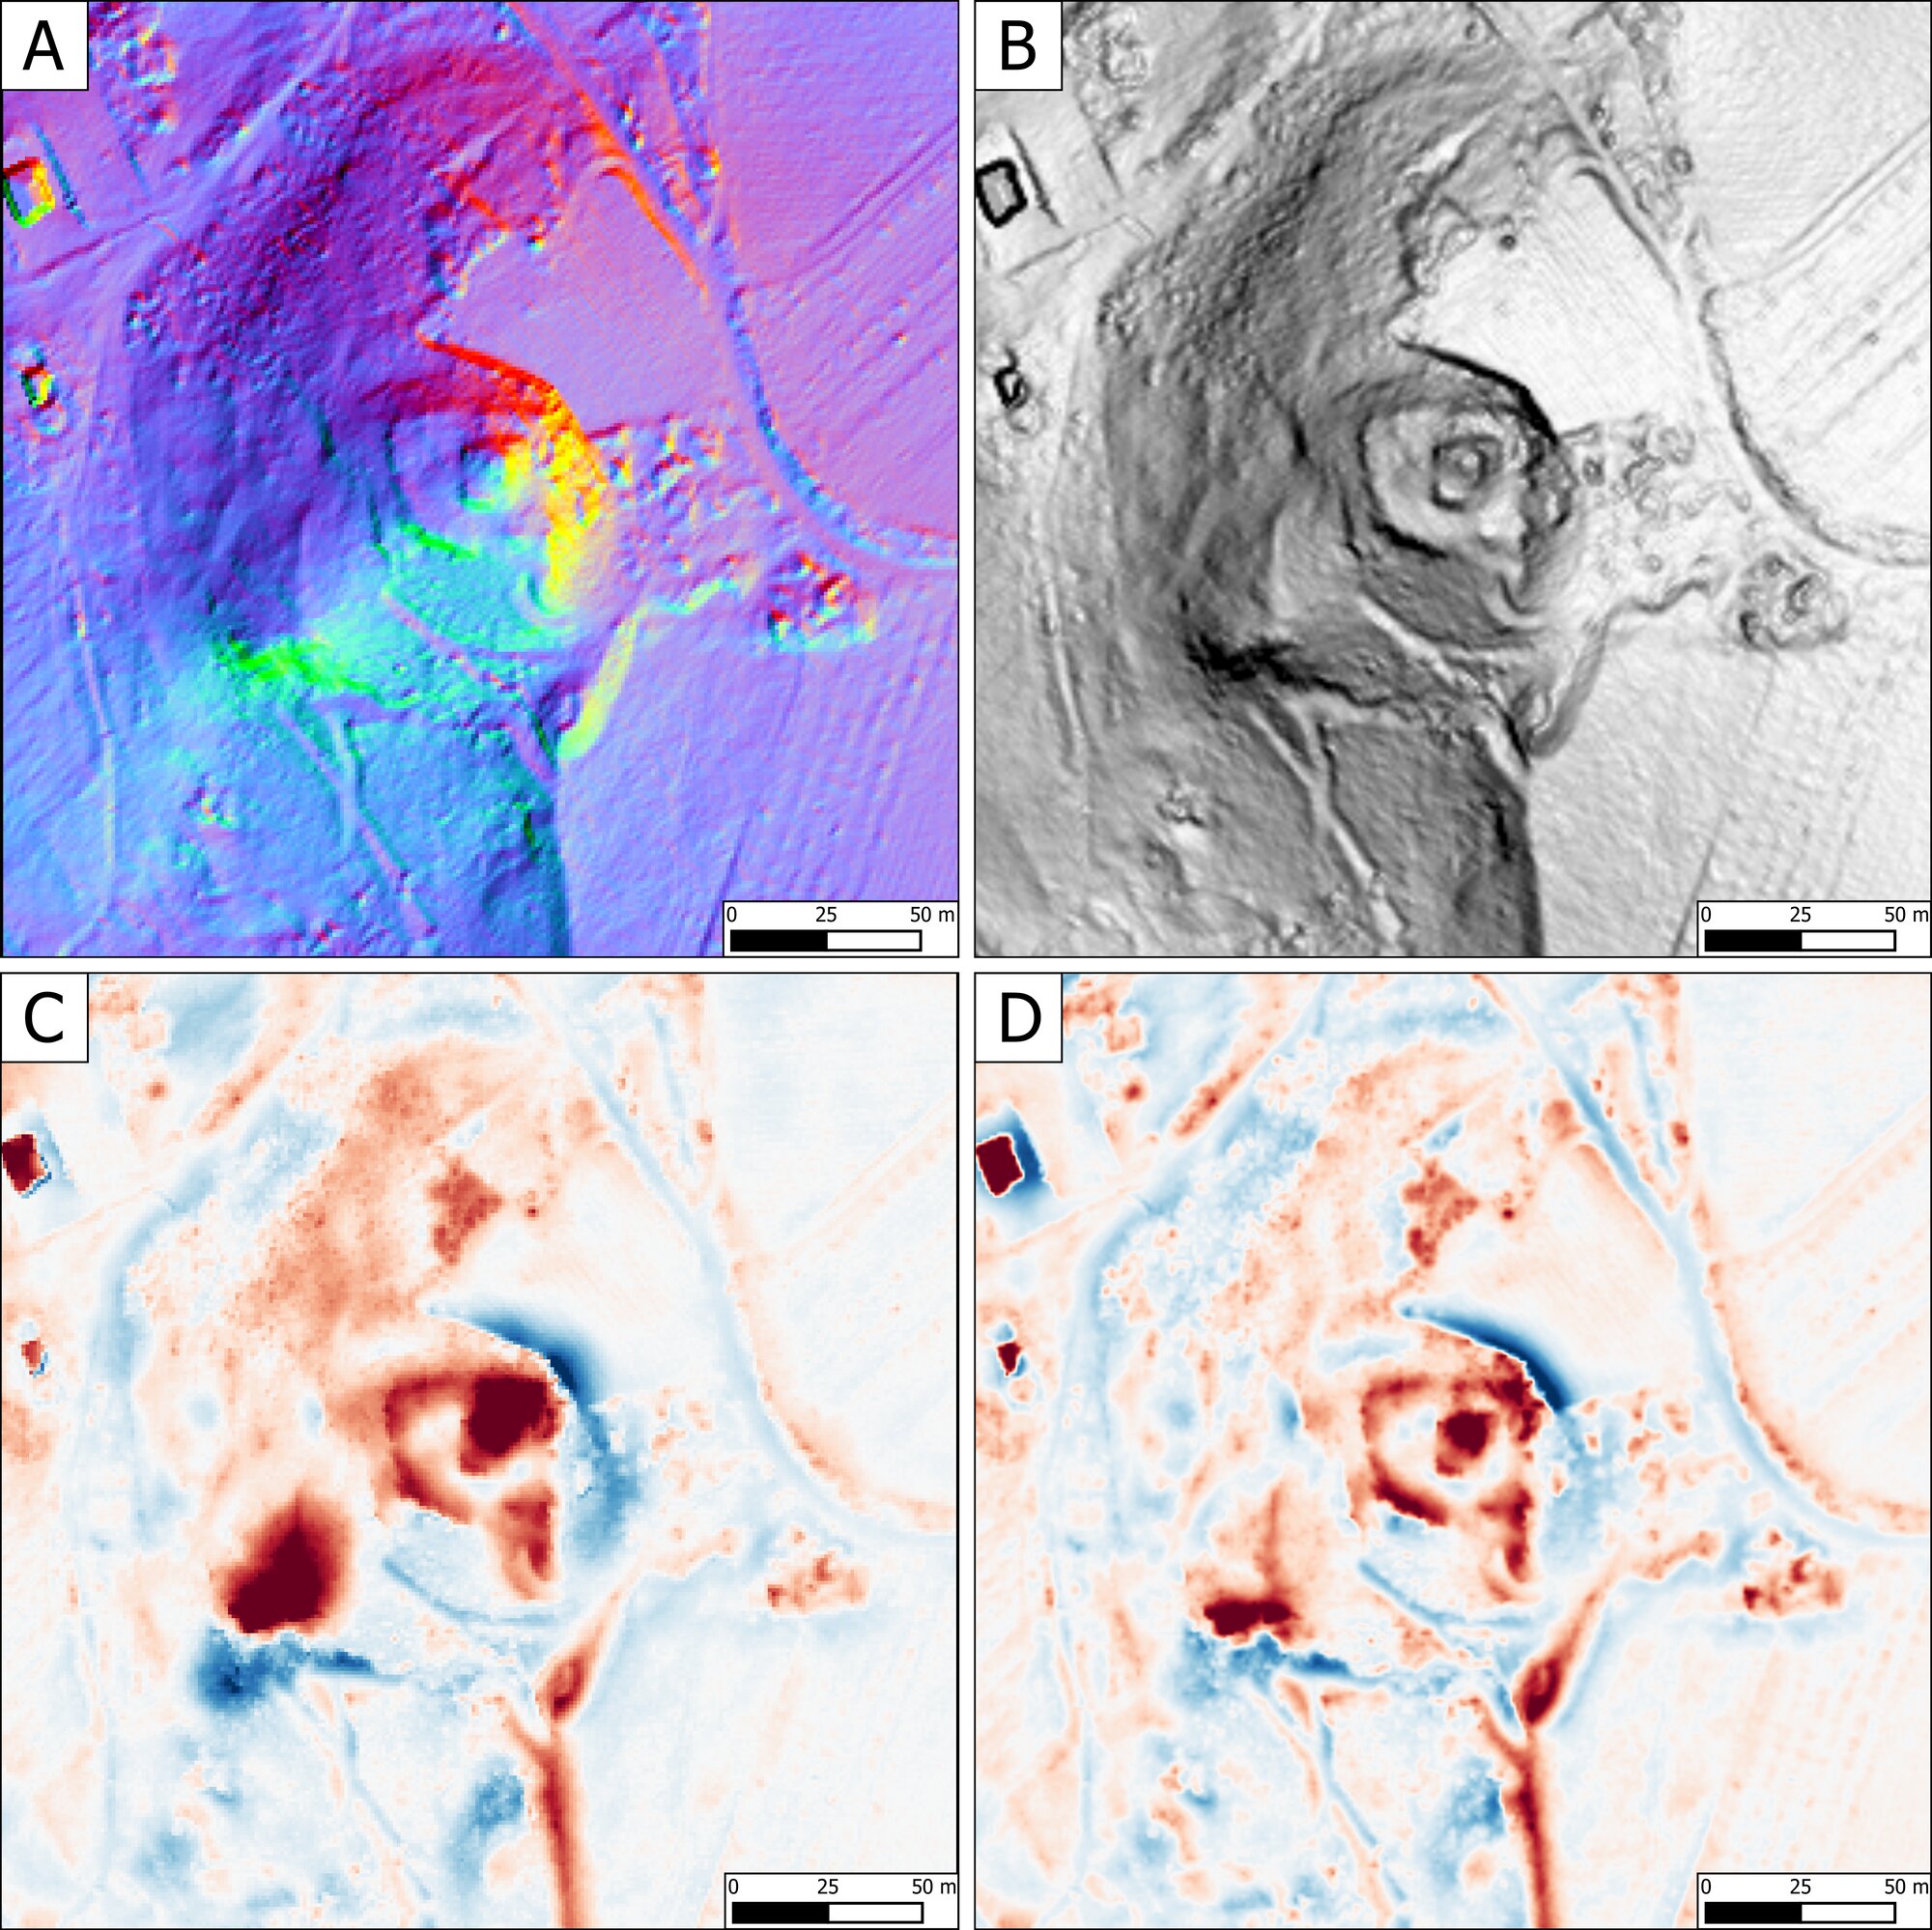 Figure 3 - A. PCA processed in RVT; B. SP processed in RVT; C. SLRM processed in RVT; D. LRM processed with the Local Relief Model tool in ArcGIS Pro.
 -
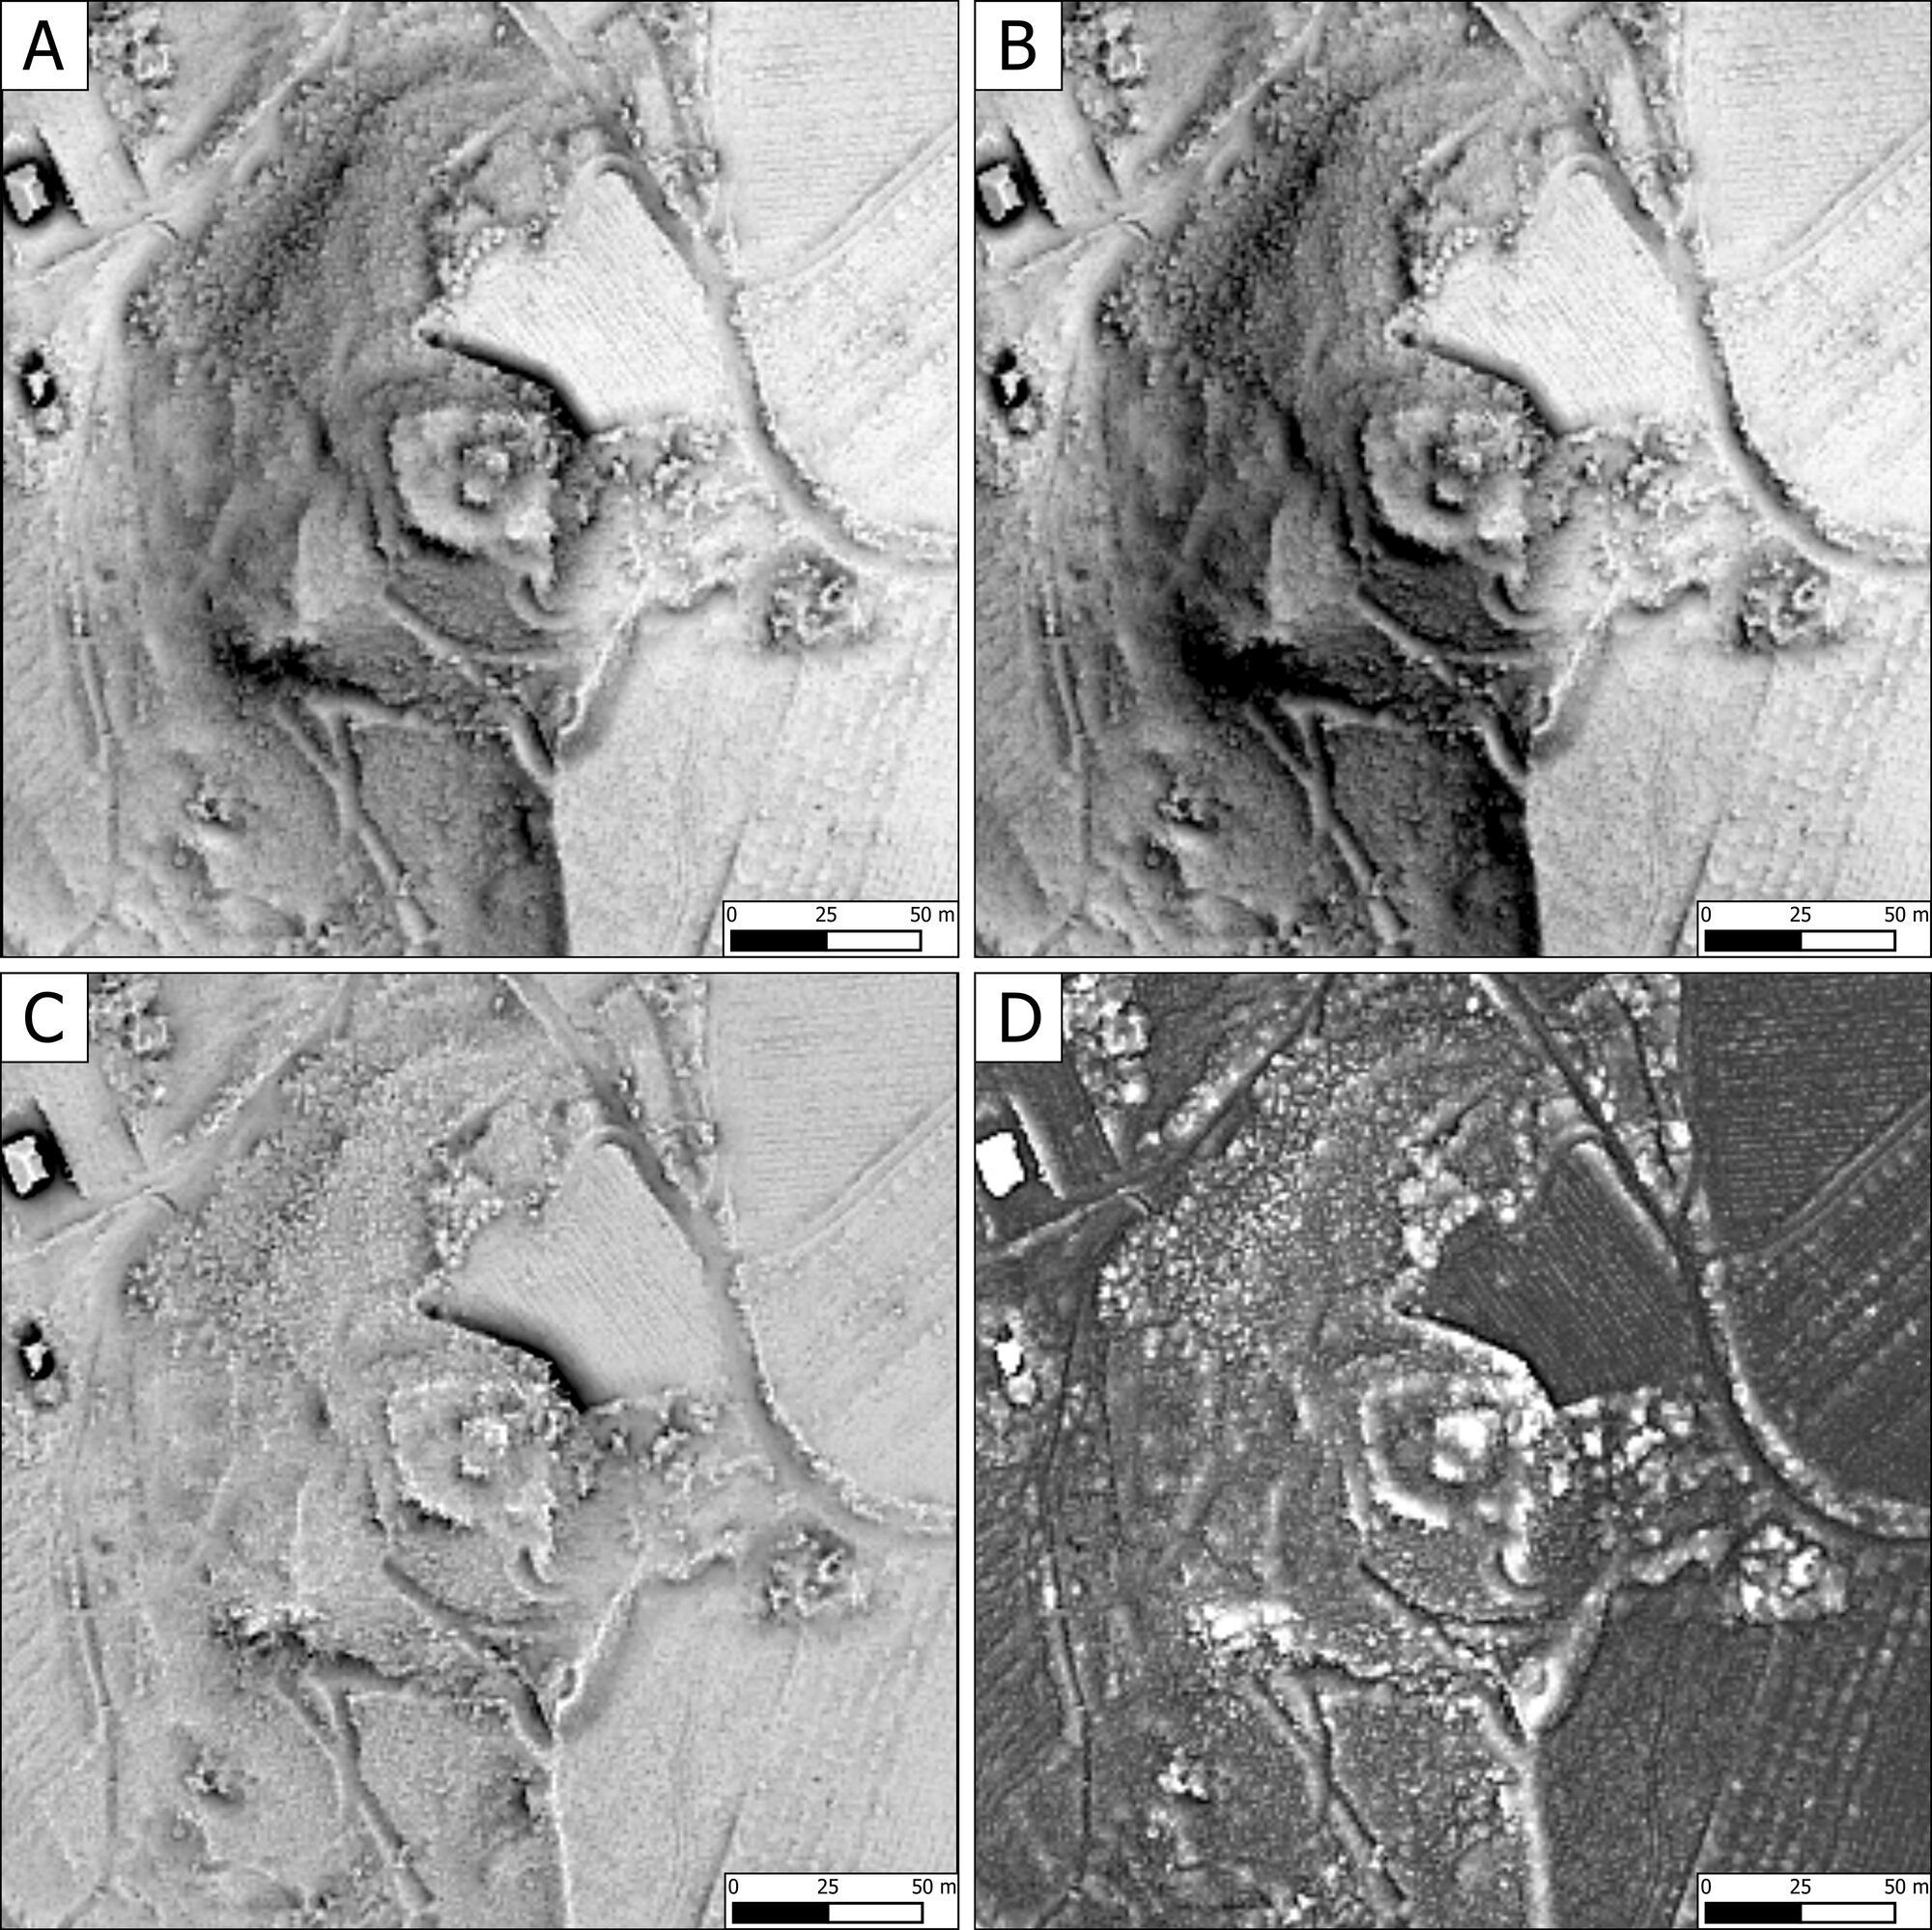 Figure 4 - A. SVF processed in RVT; B. ASVF processed in RVT; C. OP processed in RVT; D. ON processed in RVT.
 -
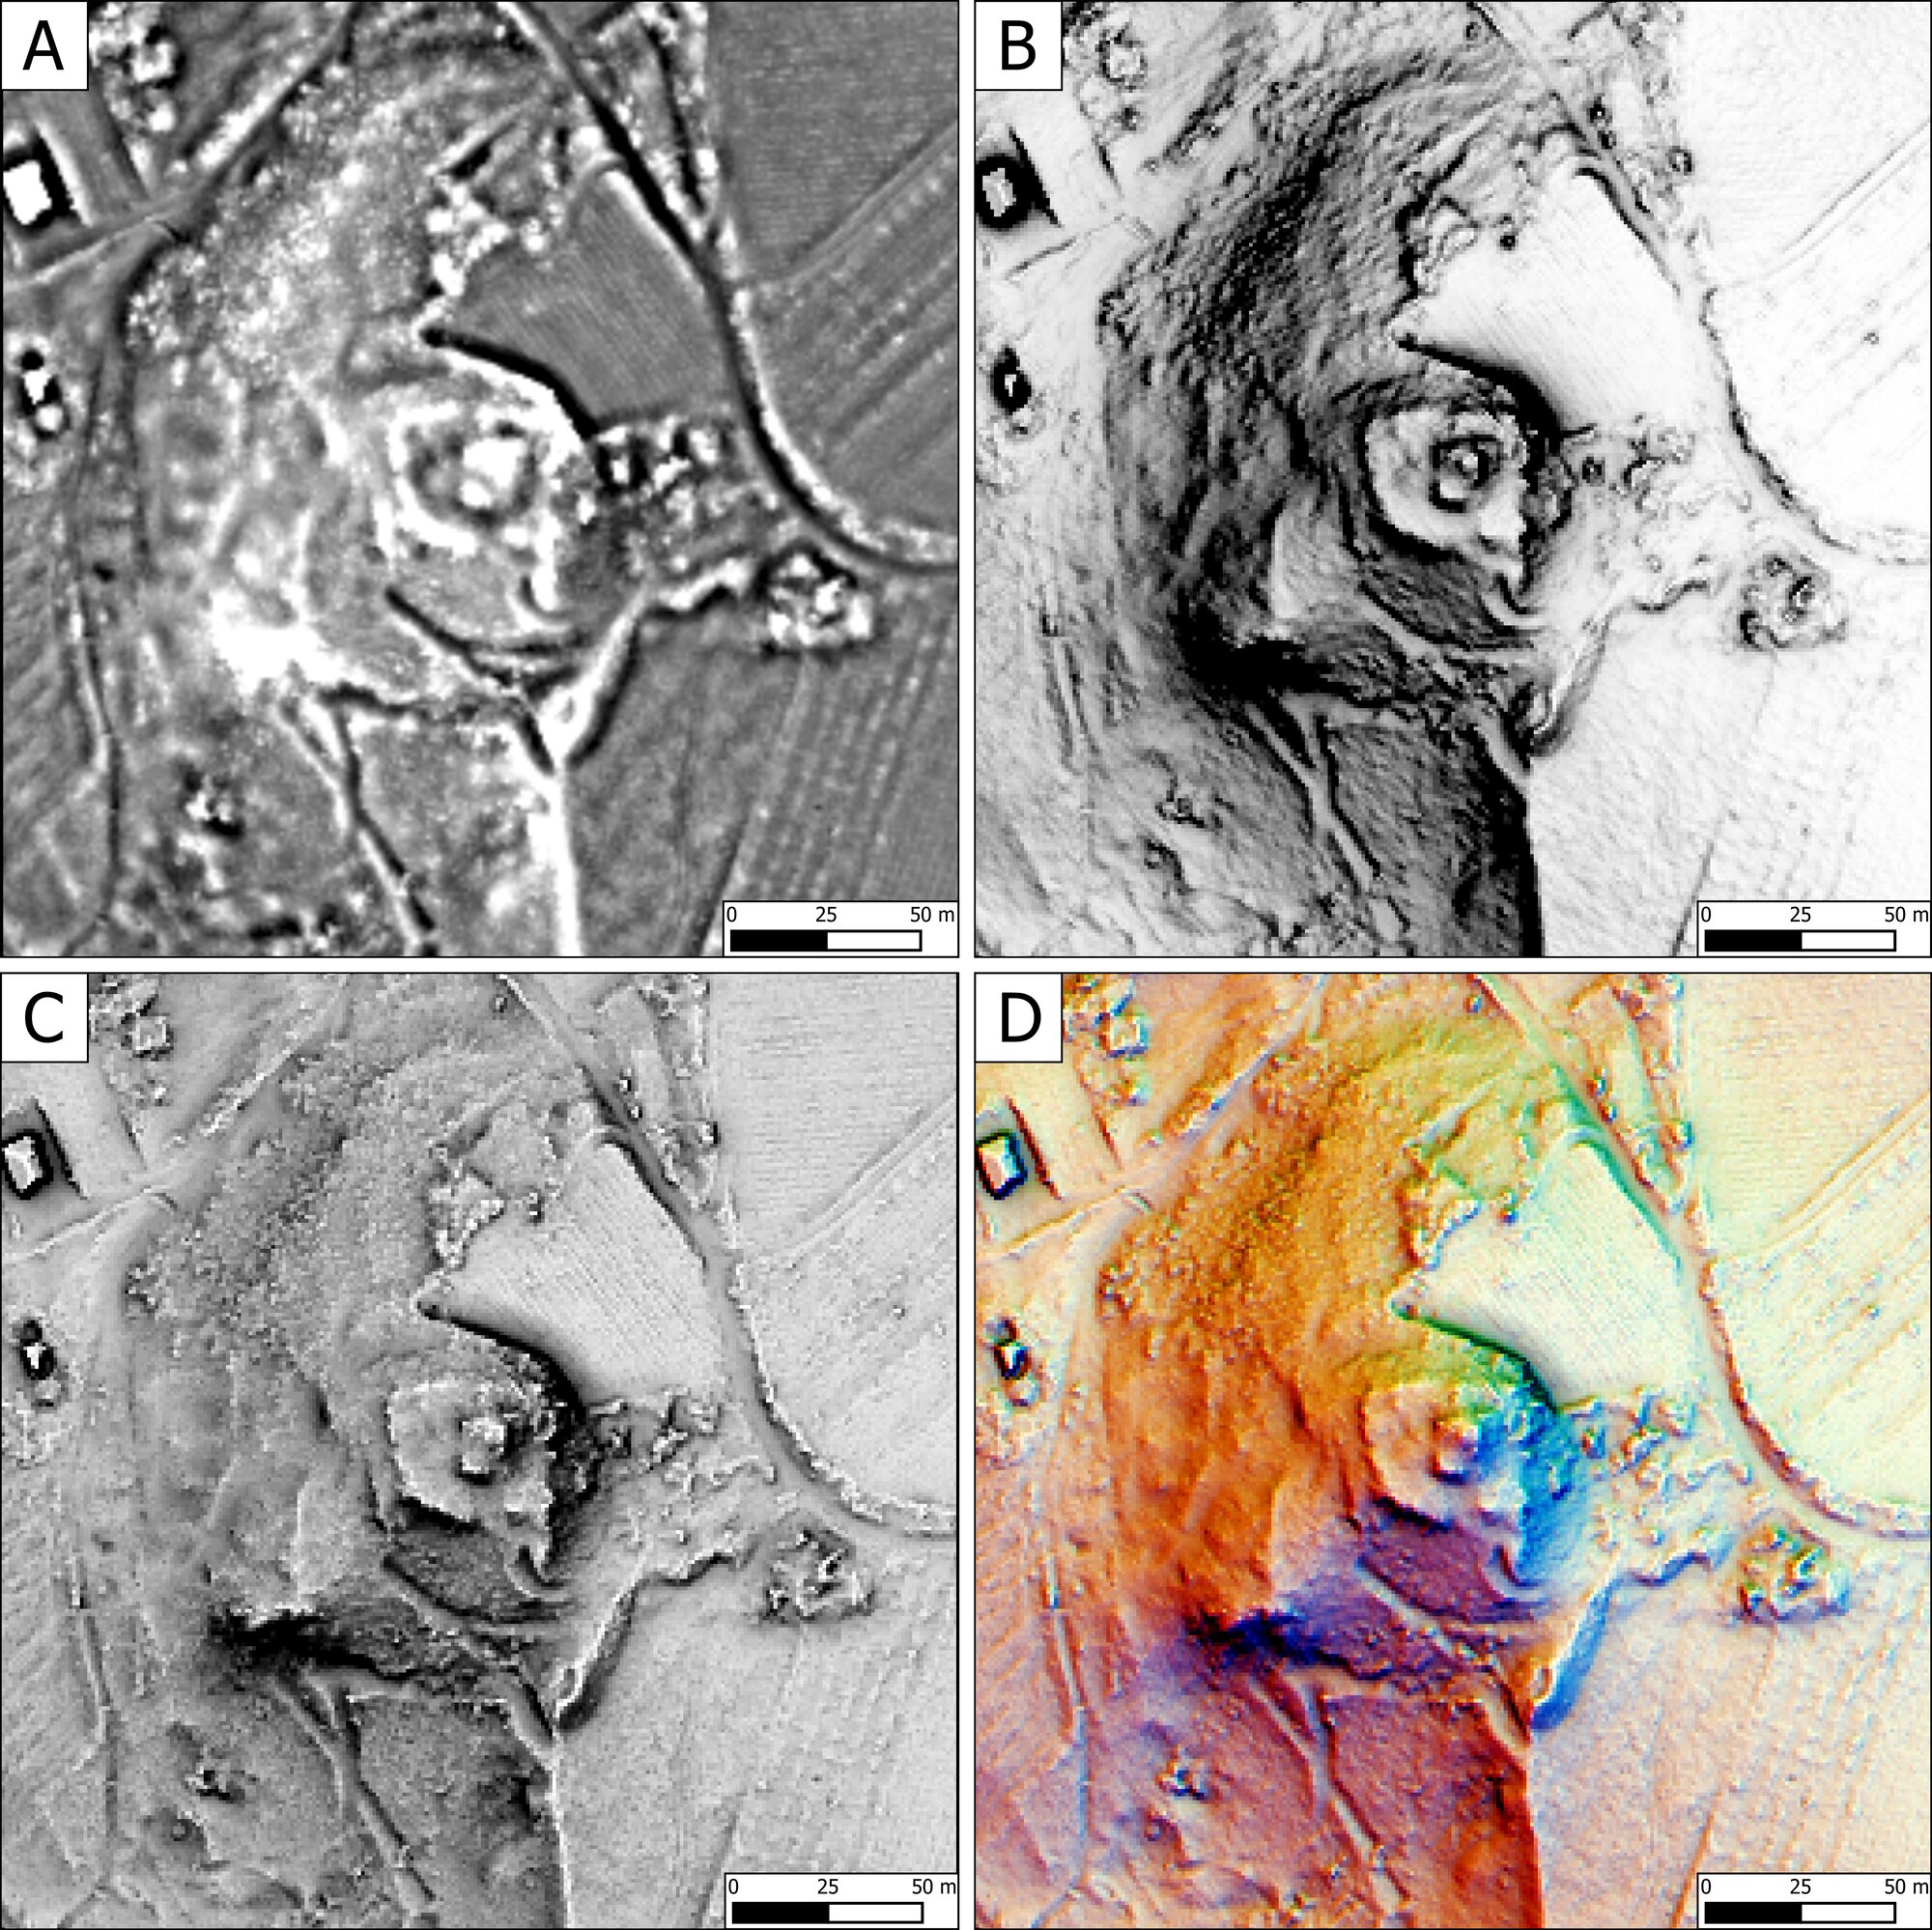 Figure 5 - A. LD processed in RVT; B. SIM processed in RVT; C. VAT with HS as firs layer; D. VAT with Multi-HS as firs layer.
 -
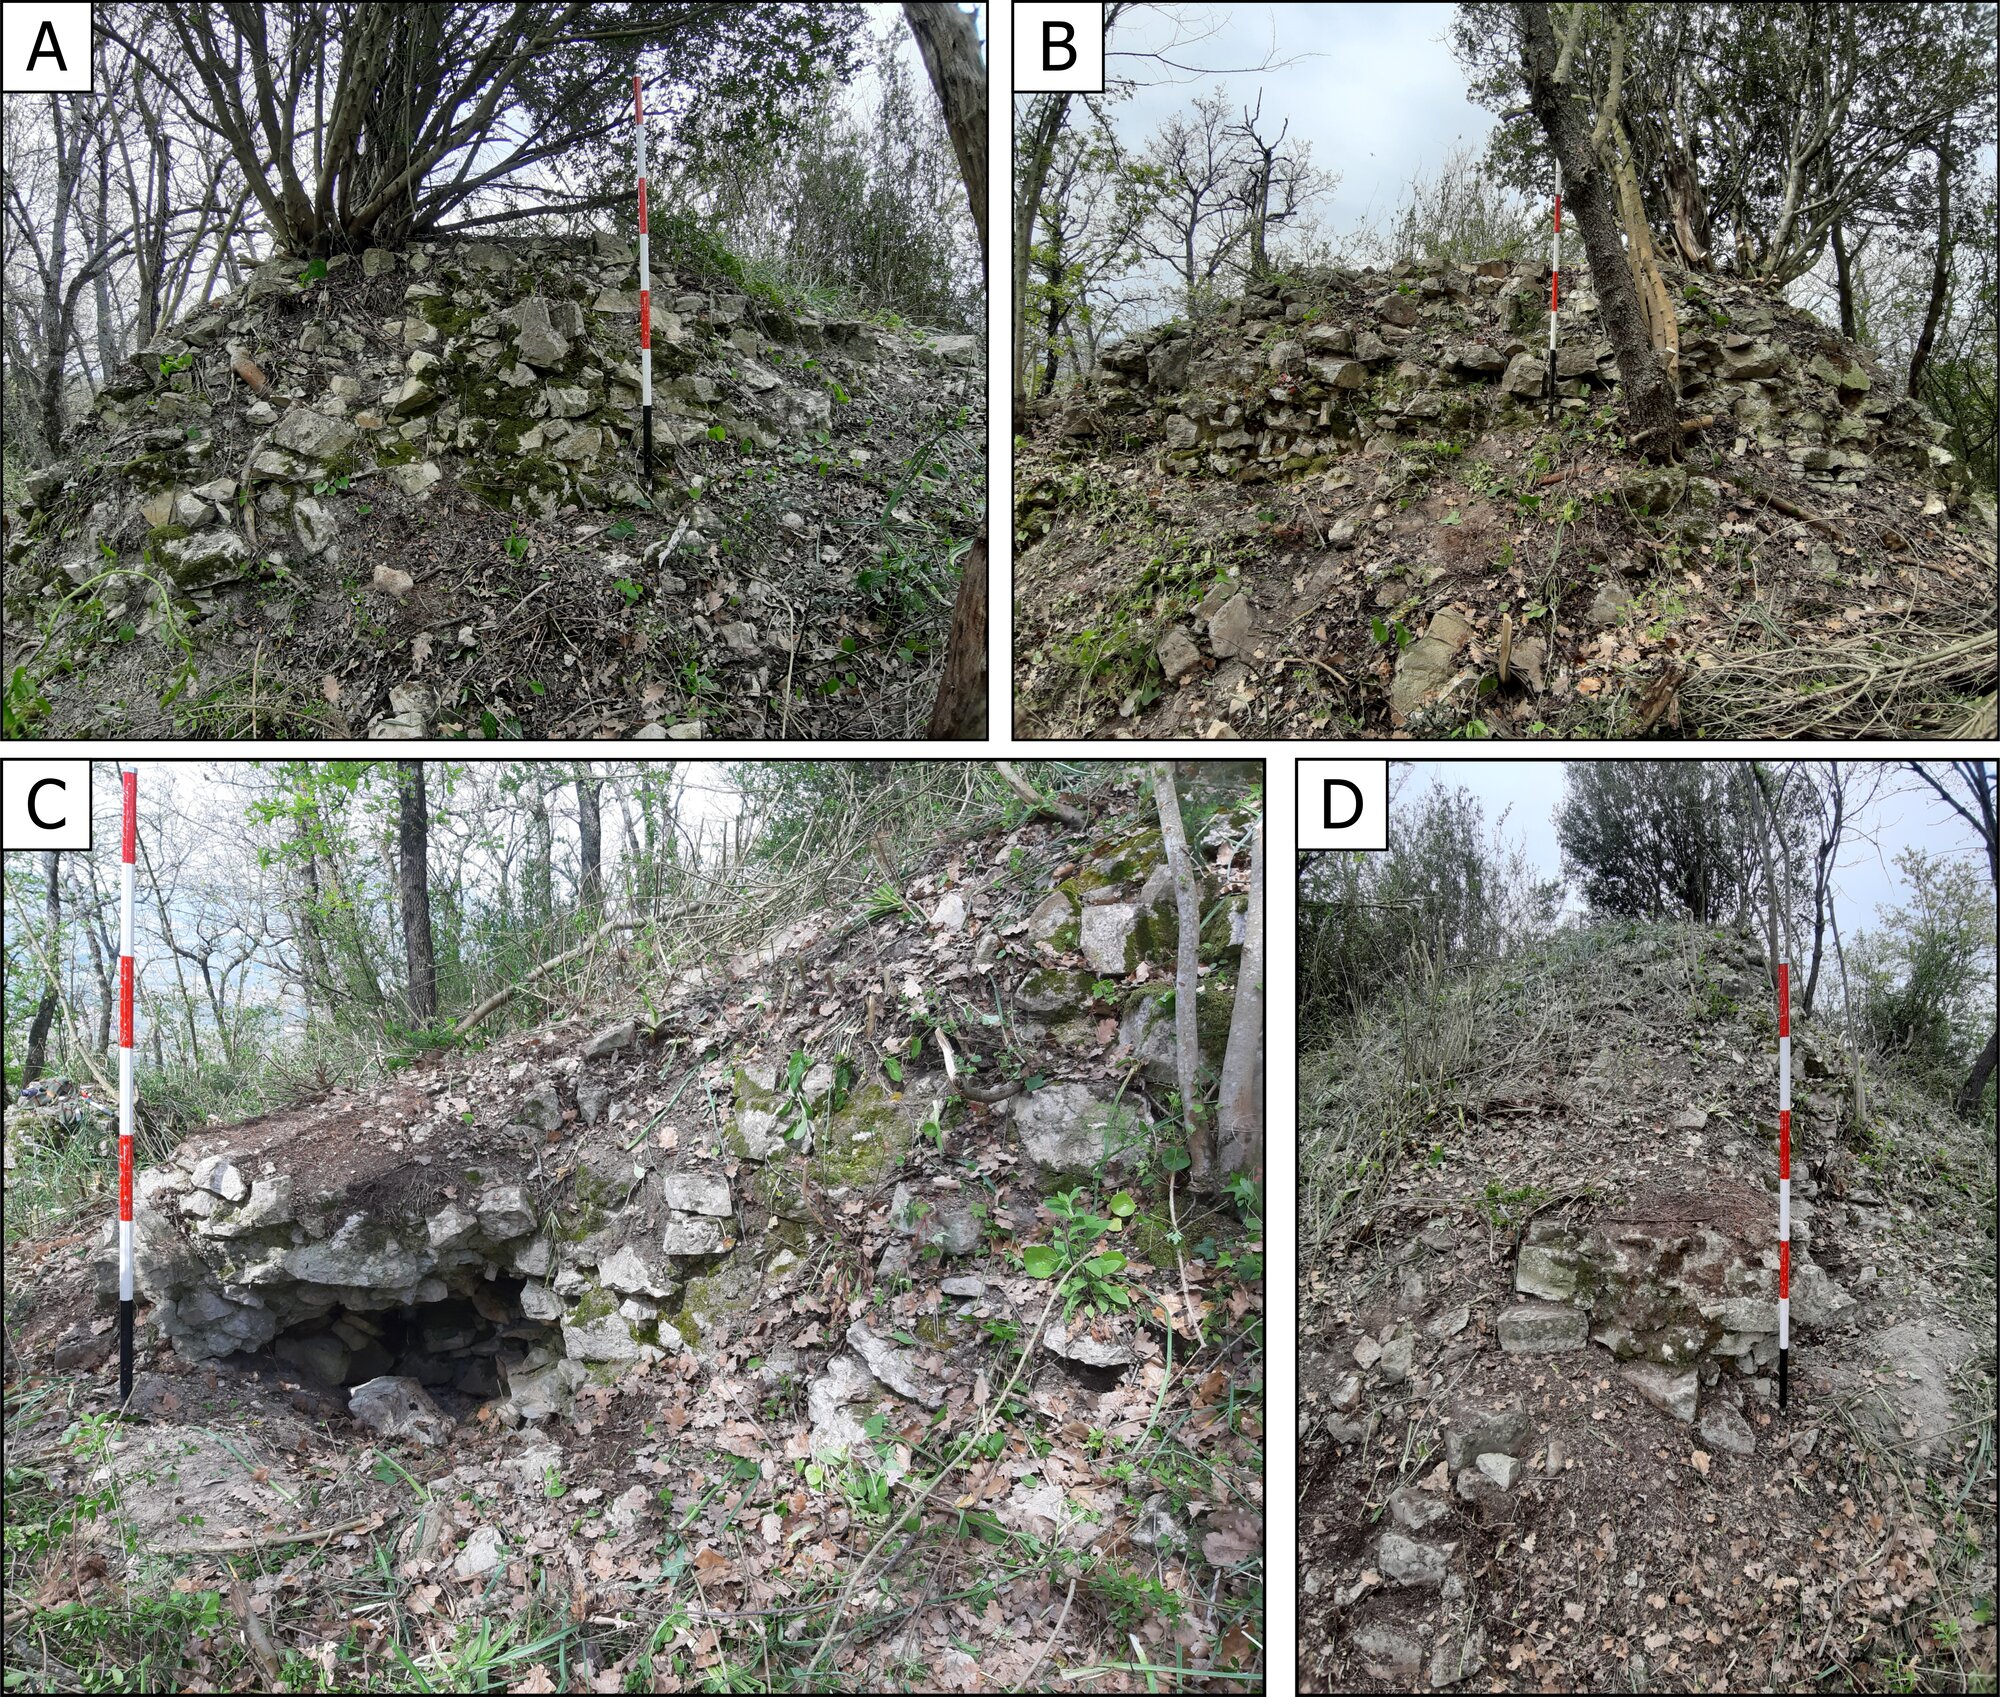 Figure 6 - North angle of the inner wall: A. North wall; B. North-west wall. West corner of the inner wall: C. Southwest wall (collapse); D. South-west wall (pictured from the south).
 -
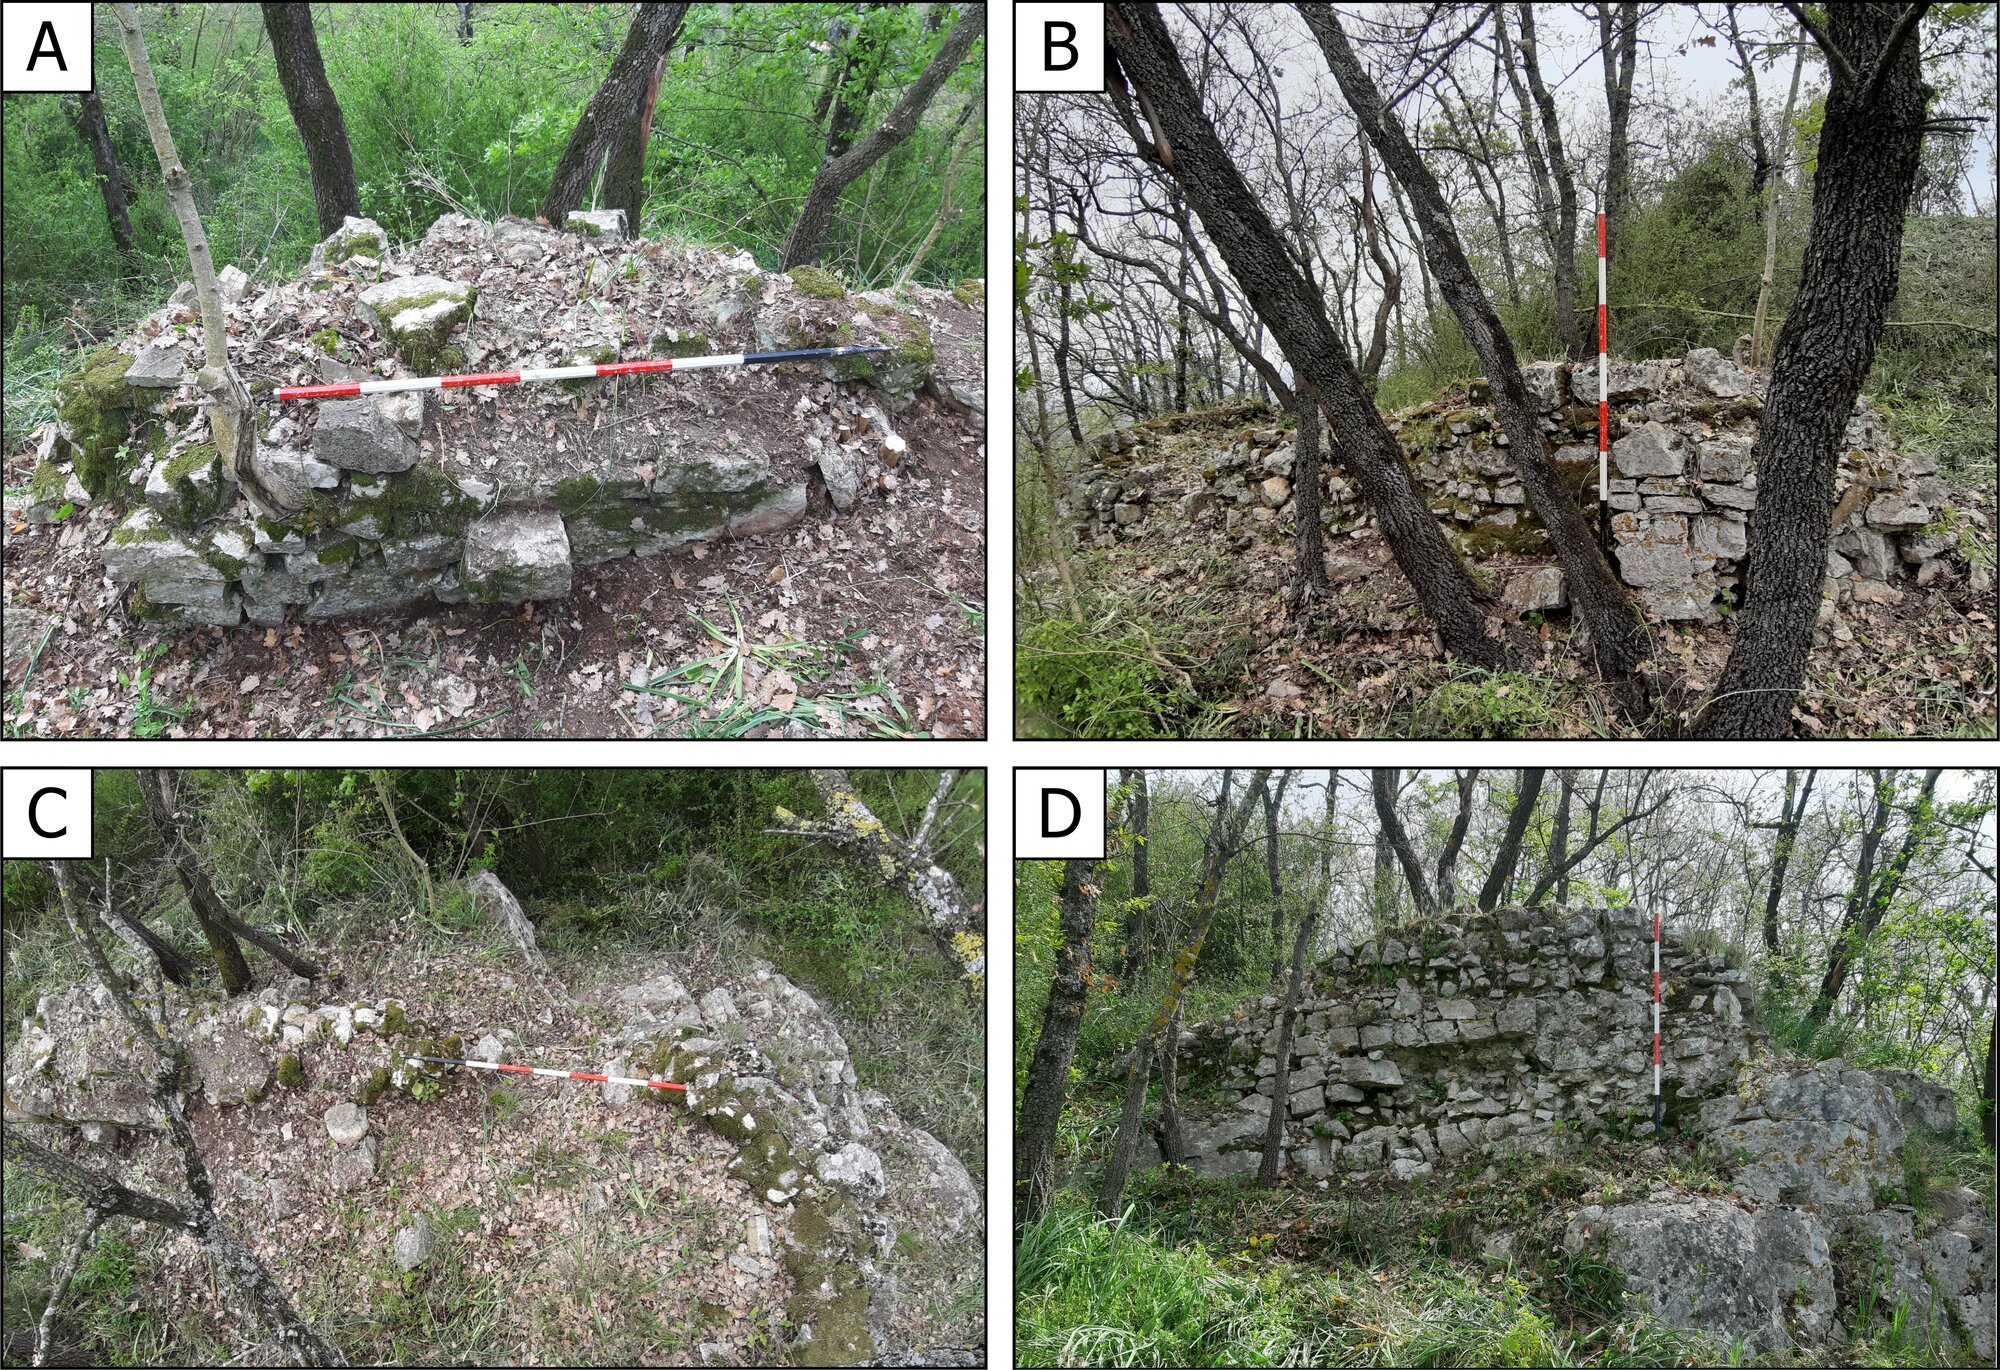 Figure 7 - South south-west of the inner wall: A. Inner side of the south wall; B. External side of the south wall; C. Corner of the south south-east wall; D. External side of the south-east wall.
 -
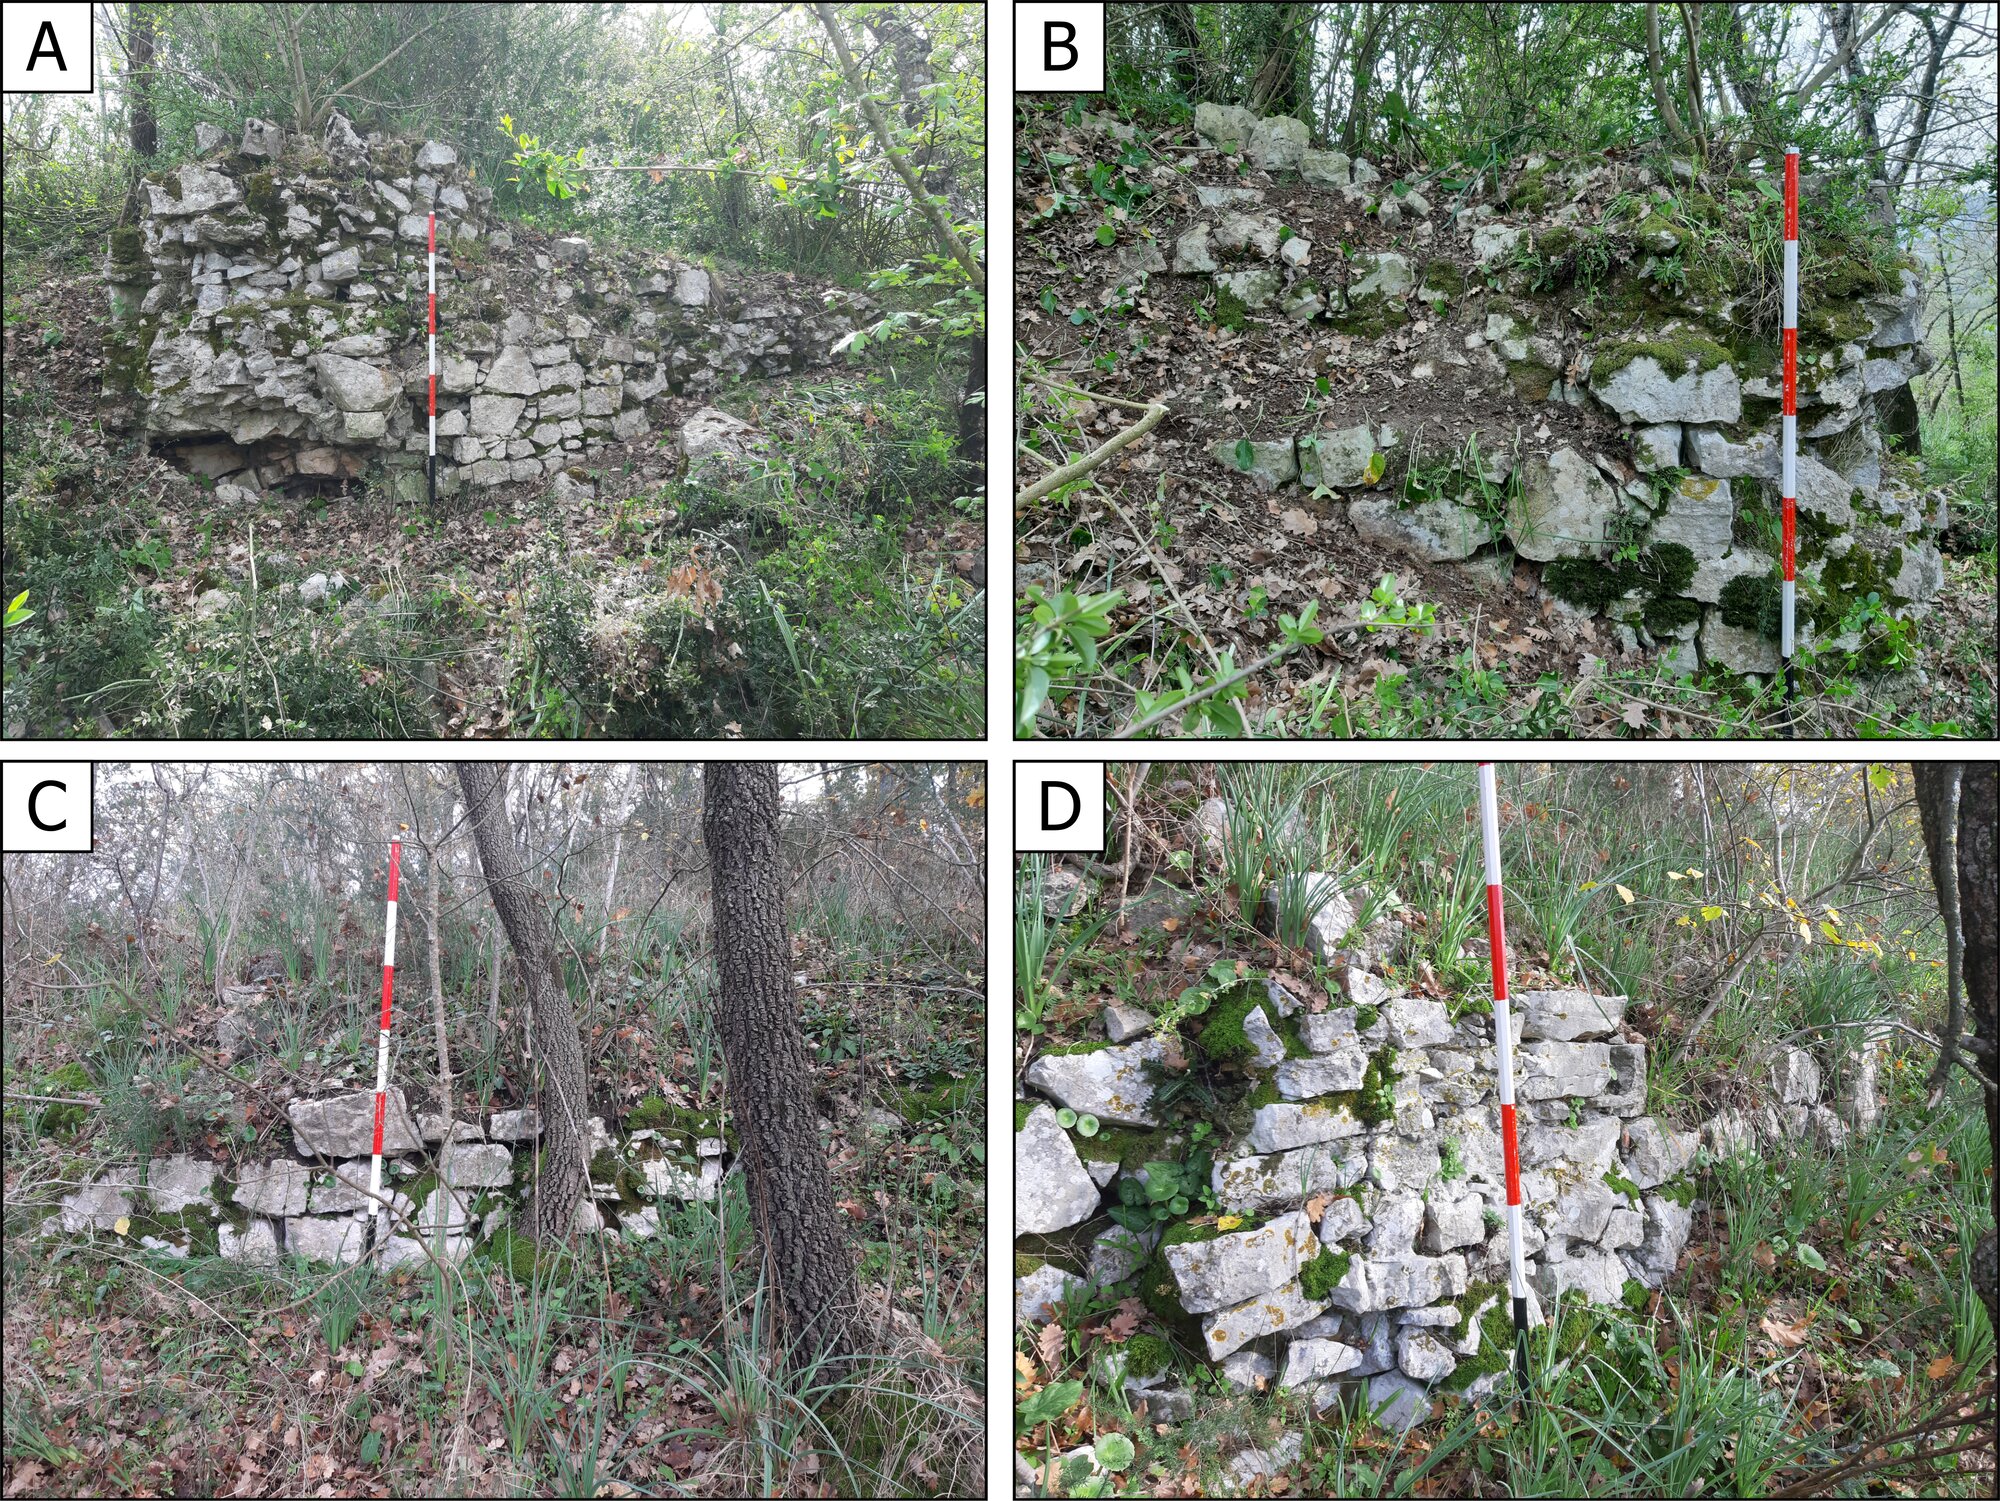 Figure 8 - North-east corner of the inner wall: A. North-east wall; B. North wall. C-D. Remains of the external wall.
 -
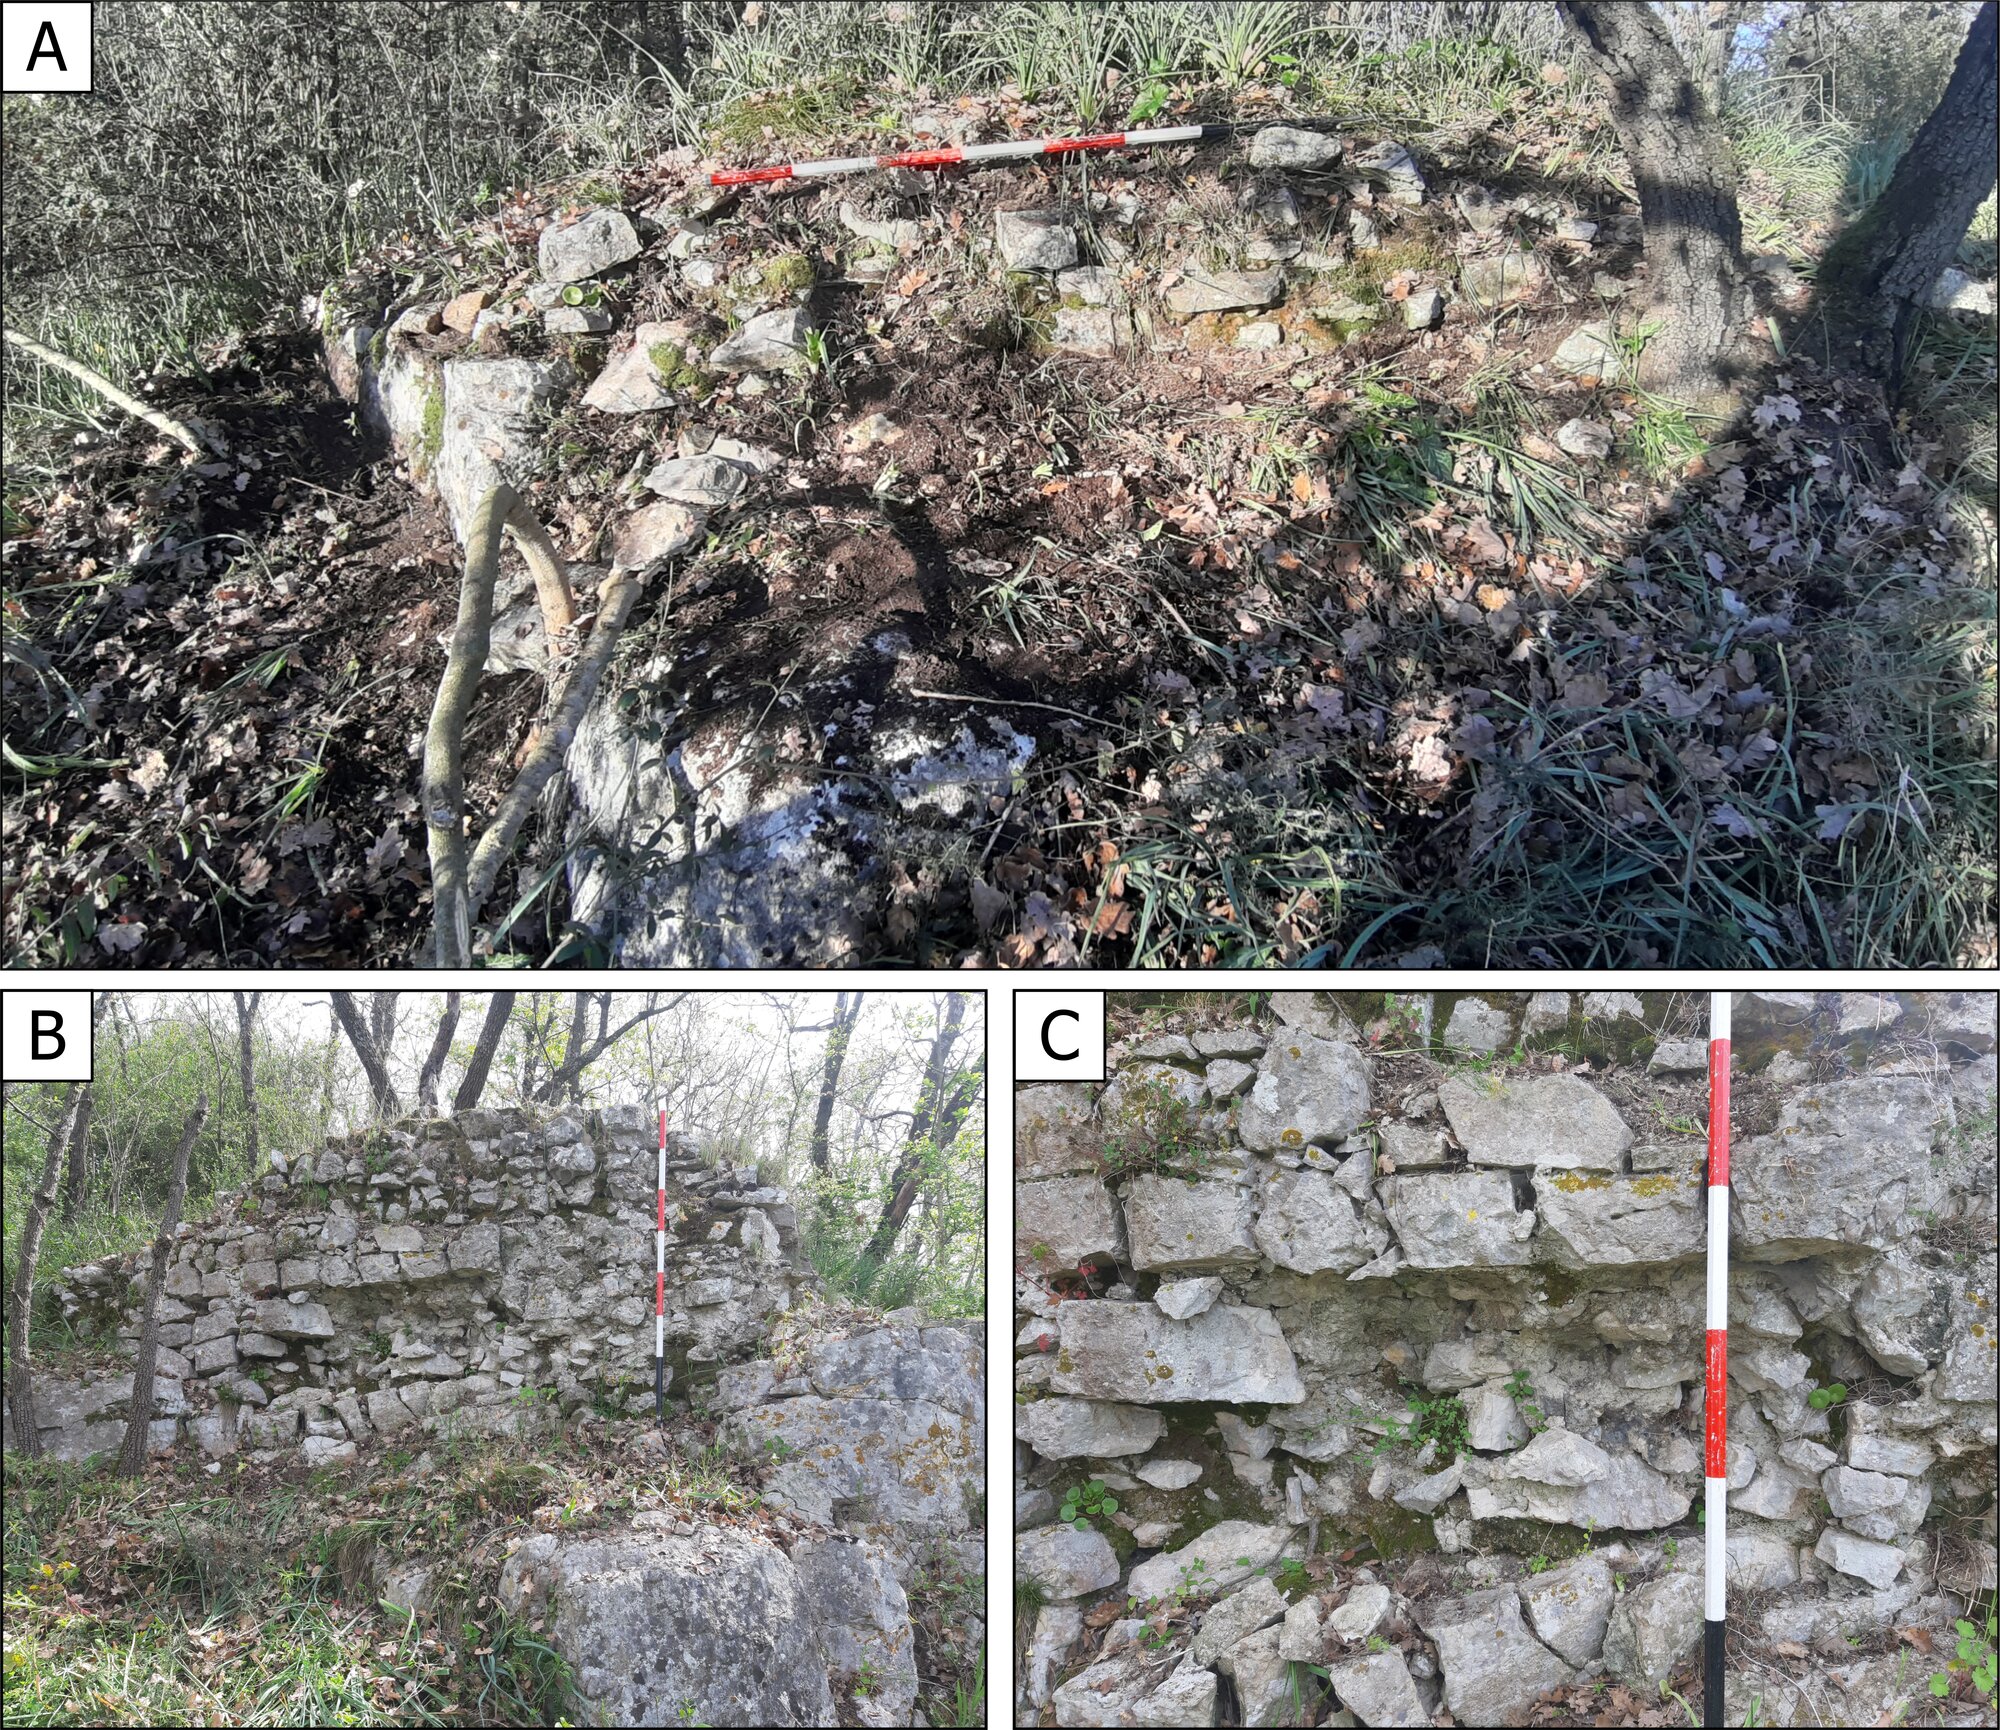 Figure 9 - A. Remains of a wall partition, located to the south. B. External side of the south-east wall; C. Detail of the internal core.
 -
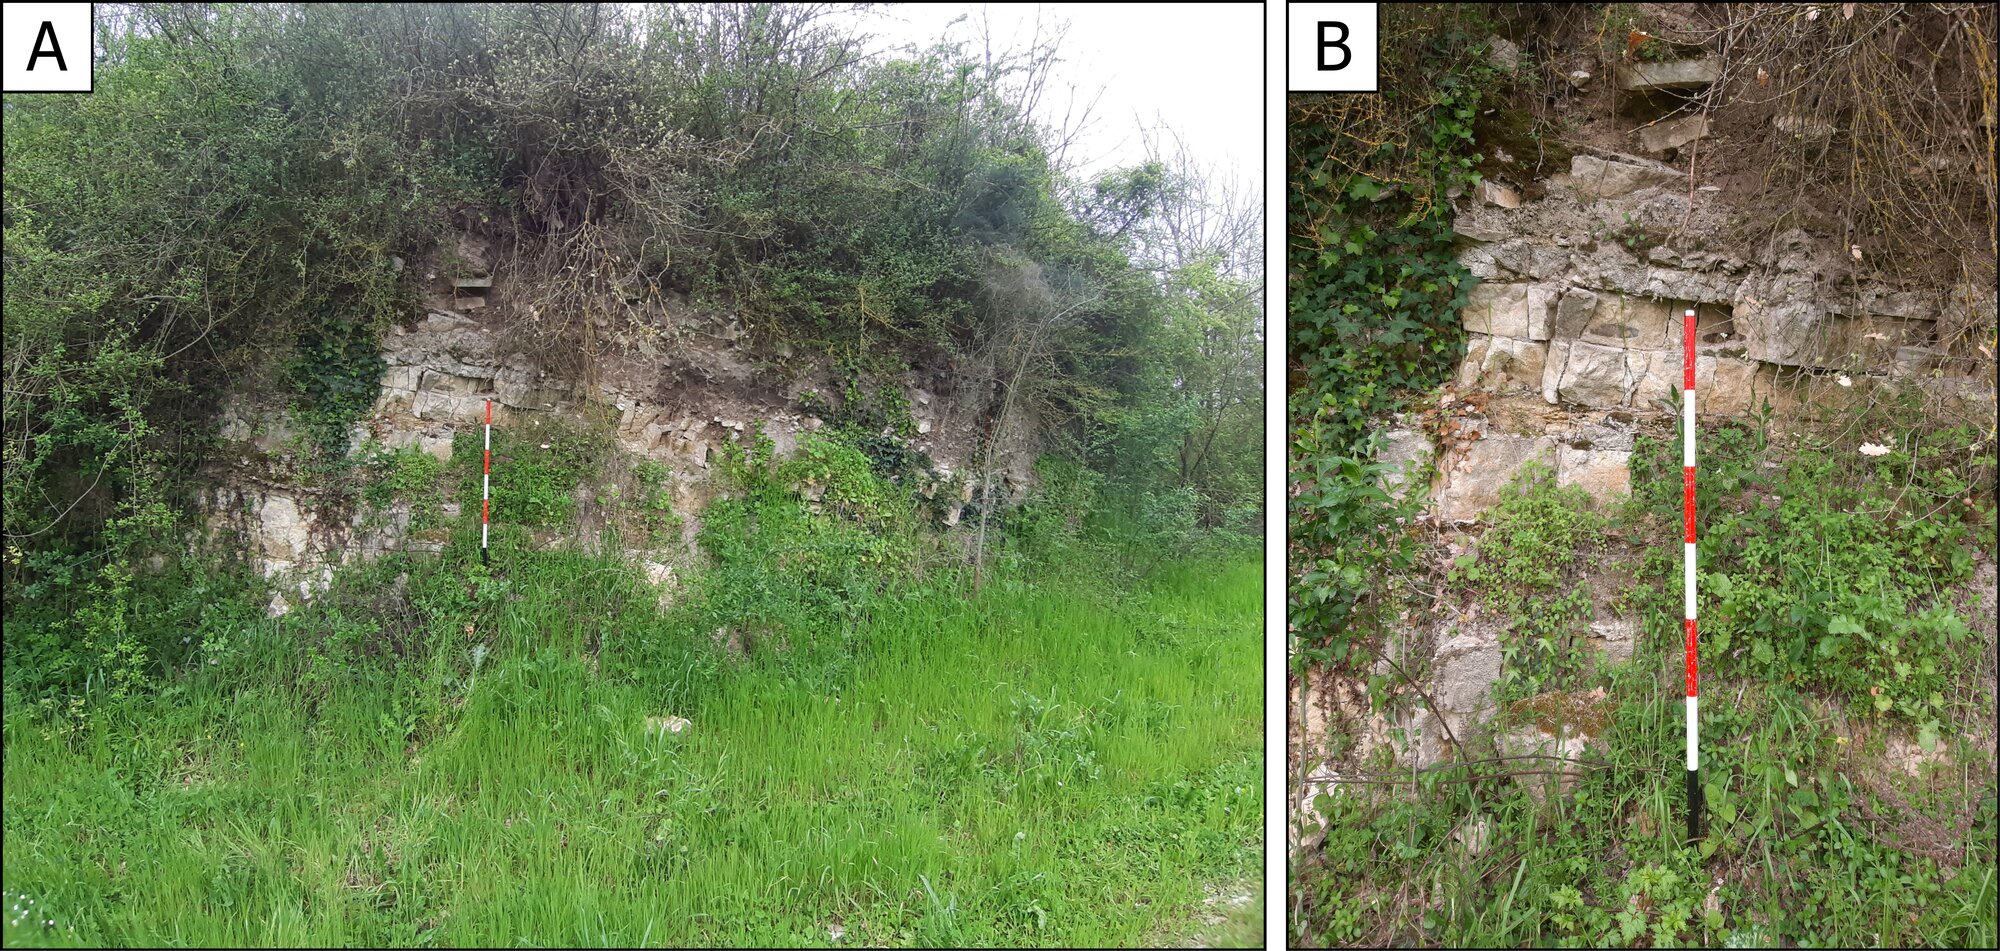 Figure 10 - A. Northern side of the hill; B. Detail of northern side of the hill.