Introduction
The project of the Archaeological Map of Ancona was first set up in 2019 through an agreement between the Superintendence of Archaeology, Fine Arts, and Landscape (SABAP) of the Marche region, in central Italy, and the University of Bologna. The project aims at using the Archaeological Map for three different goals: protection and urban planning by public authorities, research purposes, and tourist targets. Each of these aspects is reflected in various design choices, from a structural point of view, up to the database and available tools setup, as well as in the content and levels of data access and usability. From the conservation of cultural heritage perspective, this tool aspires to be employed as a platform for managing archival resources, which can be consulted and searched for in a more organized manner and made directly accessible thanks to their digitization, thus allowing easier and faster data access. It is not merely a matter of scanning documents, but rather the setup of a complex organization of existing resources. Therefore, this tool aims at complementing and interacting with the Italian National Geoportal for Archaeology, which currently represents the model used by the Italian Ministry of Culture for academic field research and for rescue archaeology practices as well (Circular no. 9 of March 28, 2024, [http://www.ic_archeo.beniculturali.it/getFile.php?id=2128]).
Over the past six years, the IT infrastructure has undergone adaptations and updates in line with the development of new open-source data management applications. Initially, a web app called PuntoZero (Iacopini 2023) was developed specifically in PHP, HTML, and JavaScript for the management of archive data and the visualization of the archaeological map, while using Leaflet JS Library for the cartographic version. In 2024, the IT infrastructure was completely modified, favoring fully open-source solutions developed and maintained by a broad international community: Directus (https://directus.io) was used for database management, and Geonode (https://geonode.org/) for the cartography. Compared to the first version used at the beginning of the project, the update offered by the new version 4.1 positively affected the outcome. The migration to this system was primarily guided by the experience and tests conducted during the implementation of various research projects led by the Digital Archaeology Laboratory at Sapienza University of Rome (LAD, https://lad.saras.uniroma1.it). Geonode was tested in the Op.e.r.a. project (Portal for the knowledge of Cultural and Historical-Archaeological Heritage), while Directus was tried out for the database management of the archaeological mission in Çuka e Ajtoit, Kestría (Albania) (https://lad.saras.uniroma1.it/ricerca/missione-archeologica-sapienza-a-cuka-e-ajtoit-albania), as well as in the IN-Rome project led by the Scuola Normale di Pisa (http://inrome.sns.it). The creation of the Archaeological Map of Ancona takes place during a period rich in initiatives and innovations in the field of cultural heritage digitization. Among these, we can mention the National Geoportal for Archaeology (GNA, Calandra 2022, Calandra 2021, [https://gna.cultura.gov.it/]) promoted by the Central Archaeology Institute, MAGOH by the University of Pisa (Gattiglia 2021, [https://magoh.cfs.unipi.it/]), and, of course, the pioneering Territorial Information System of Rome (SITAR, [https://www.archeositarproject.it/]), which is undergoing further developments.
The completion of data digitization and the analysis of all documents related to the archaeology of Ancona have led to a new understanding of the city’s urban planning compared to previous studies and to the reconstruction of paleosols from a diachronic perspective, going from prehistoric times up to the Roman era 1 .
Digitization and data archiving
The archive documents related to archaeological findings in the city of Ancona were digitized in 2019. This involved cataloguing various archival units located at the headquarters of the SABAP in Ancona. Archaeological data is divided into six archive collections: historical, administrative, dossier, excavation diaries, drawings, and photographs.
Each one preserves a specific part of the archaeological data, from the history of its discovery (historical or administrative archive) to the development and results of the excavations (dossier, excavation diaries, drawings, and photos). The scattering of information stimulated one of the project’s initial aims to make all available data accessible on a single screen. Approximately 12.000 files related to 212 items were scanned at a resolution of 300 dpi. Data entries cover a wide chronological range from the Eneolithic age to the Renaissance period and they comprise both the most significant archaeological evidence and individual accounts of sporadic findings. They also include details of stratigraphic sections exposed during archaeological surveys that did not yield structural evidence, core samples and other interventions that did not bear any results at all. At the same time, available archive plans were georeferenced to precisely locate archaeological evidence.
After the initial phase, the next step was to build a PostgreSQL database with the PostGIS extension to store all the information derived from individual folders. The database mainly consists of an “Archaeological Sites” table connected in a one-to-many relationship with six others: “Document Archive”, “Drawing Archive”, “Elevations”, “Dating”, “OGTT (object type)”, and “Structures”. At the project’s outset, the “Archaeological Sites” table included all the fields of the ICCD’s “Scheda Sito” 3.0 model. At present, they have been reduced to those required by the MOSI card to facilitate interchange with the GNA by the Central Archaeology Institute. Directus, an open-source software, was chosen for administrative area management and database handling. In addition to a user-friendly interface for data entry and modification, it offers numerous features, including Access Controls/Permissions, Configurable Workflow, Content Management, Customizable Forms, Data Import/Export, Document & File Management, Filtering, Full Text Search, and Visual Modeling. The software also allows API access both in REST and GraphQL to manage data within the database. The API has predictable resource-oriented URLs, relies on standard HTTP status codes, and uses JSON for input and output. The choice to use this software stems from its excellent performance demonstrated during tests on some projects of the Digital Archaeology Laboratory directed by Julian Bogdani, who has been involved in finding possible alternatives or replacements for the Bradypus (Bogdani 2022) software he developed himself (https://lad.saras.uniroma1.it/ricerca/bradypus-cloud-databases/). The test bench was the Archaeological Mission in Çuka e Ajtoit, Kestría (Albania) in 2022, when Directus was used as software for managing archaeological data from both excavation contexts and field research. The software proved extensively versatile in handling the complexity of archaeological data, leading to the migration of the Archaeological Map of Ancona to this system. The transition was relatively swift since Directus, like the original project, employs PostgreSQL as reference database. Therefore, it was possible to quickly transfer data from one database to another.
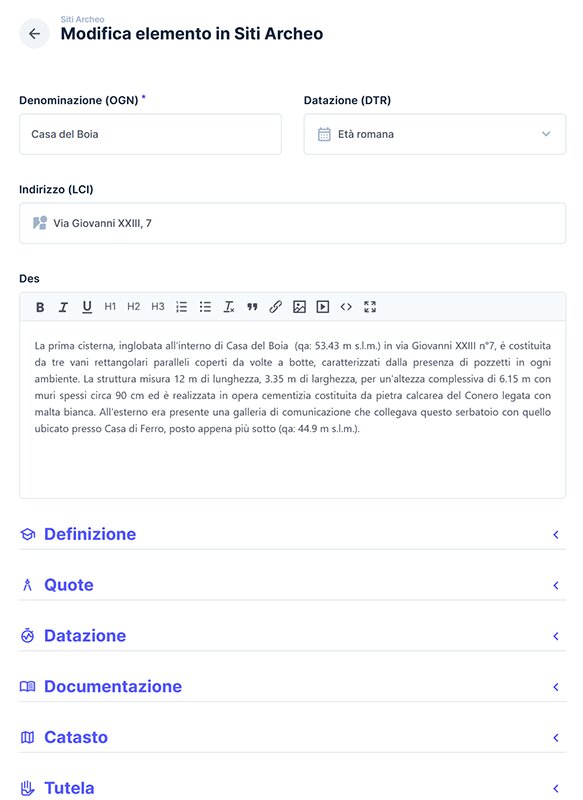
Moving to the sections that compose the descriptive tab for each archaeological record in the administration area, these are divided into two. The first is more general, including code, name, whereabouts, generic dating, and description, while the latter is divided into six specific groups: definition, elevations, specific dating, documentation, cadastre, and conservation acts (Figure. 1). In “Definition”, archaeological data is described according to the ICCD’s OGD and OGT fields specifying the definition and type, e.g., Burial Area (OGD) and Tombs (OGD). In addition, discovery modality (OGM), year of detection and conservation status (OGB) are also reported. “Elevations” includes general data for both relative and absolute site elevations. There is an additional linked table reporting all elevations of the archaeological site, specifying the absolute reference elevation, the absolute deposit elevation, the relative deposit elevation, and what that specific data refers to—whether it is a calculated elevation point from the crest of a wall or a floor plane and the chronology to which it could be associated. Clarifying this information for each archaeological record allowed the reconstruction of planimetric trends for the living levels in those area of the city where data were numerous enough and the stratification of different chronological phases was more evident. In the “Dating” section, the initial and final dates are entered in numeric format (e.g., -700 for 8th century BCE), along with their reliability assessment. A table is associated with these basic elements, listing the general dating (e.g., Roman period), the specific one (e.g., Republican period), definition, and type, highlighting the different phases of the site, the typological change over time, and the different ways areas were used. Two tables are associated with the “Documentation” section as well, one listing all archive documents related to that specific site, and the other for all drawing codes available in the archive. From here, archive folders are directly accessible and downloadable in .zip format, or it is possible to view drawings with additional information about individual files. In addition to the Cadastre section (which includes some fields for storing historical cartographic information) and the one related to Conservation acts, the last part of the site card consists of a table detailing vectorized elements related to the digitization of drawings.
The digitization of drawings involved vectorizing each element of the floor plan, specifying a few well-defined attributes such as the site ID, the chronological phase ID of the site, the description of the element, the typology (M: wall; S: threshold; C: channel; P: floor, Pm: mosaic, T: tomb), and the consistency (0: non-existent/hypothesized; 1: existing). With these elements, it is possible to automatically build a map with different chronological phases, labeled with different colours. For each floor plan, users can get an idea of which records actually exist and which have been hypothesized while wall structures and floor plans are distinguished by different graphic textures. A similar schema was used in the PAThs project, which proposes a Simple Vectorization Protocol (https://docs.paths-erc.eu/data/svp; Bogdani 2020).
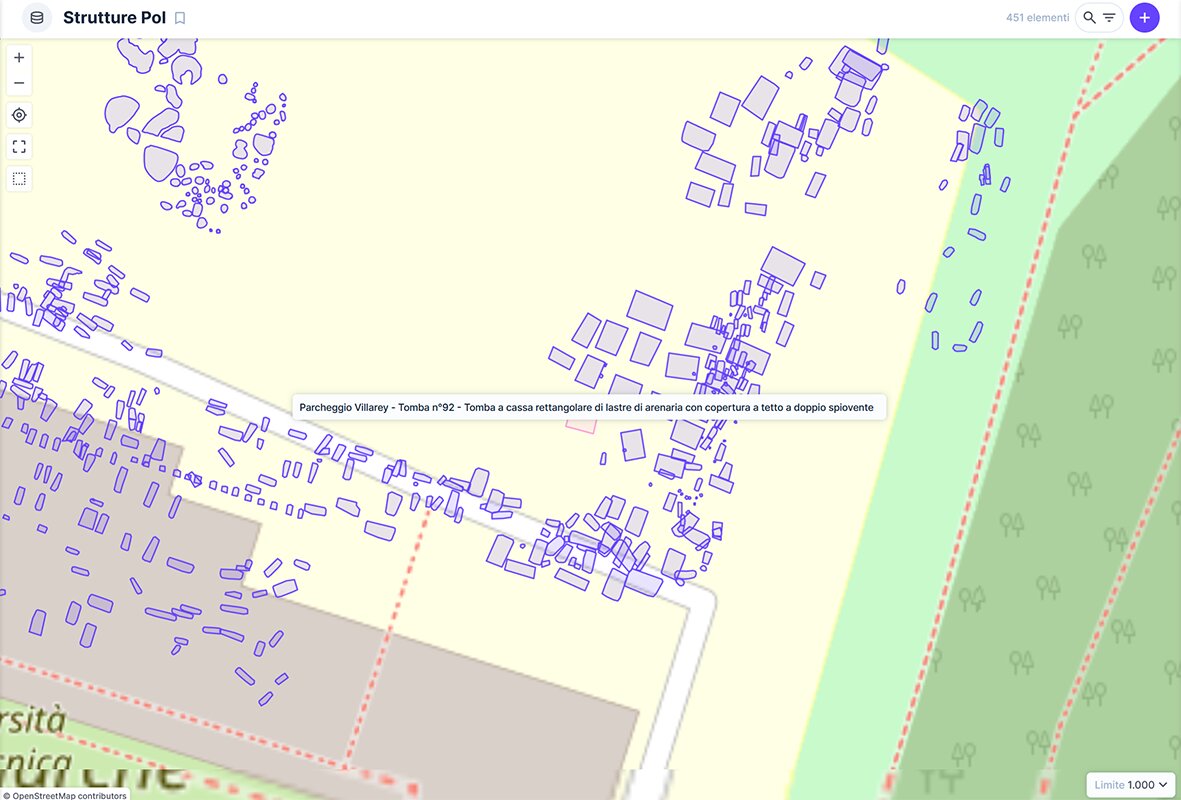
From the administration area, both documents and drawings can be consulted directly using the search tool to identify elements of interest, which can then be exported in various formats (CSV, JSON, XML). The platform already provides the ability to manage access permissions to different data in both read and write mode, and user groups with specific permissions can be created: for example, a freelance professional can be allowed to access a specific card to add excavation data or floor plans (Figure. 2 - Figure. 3).
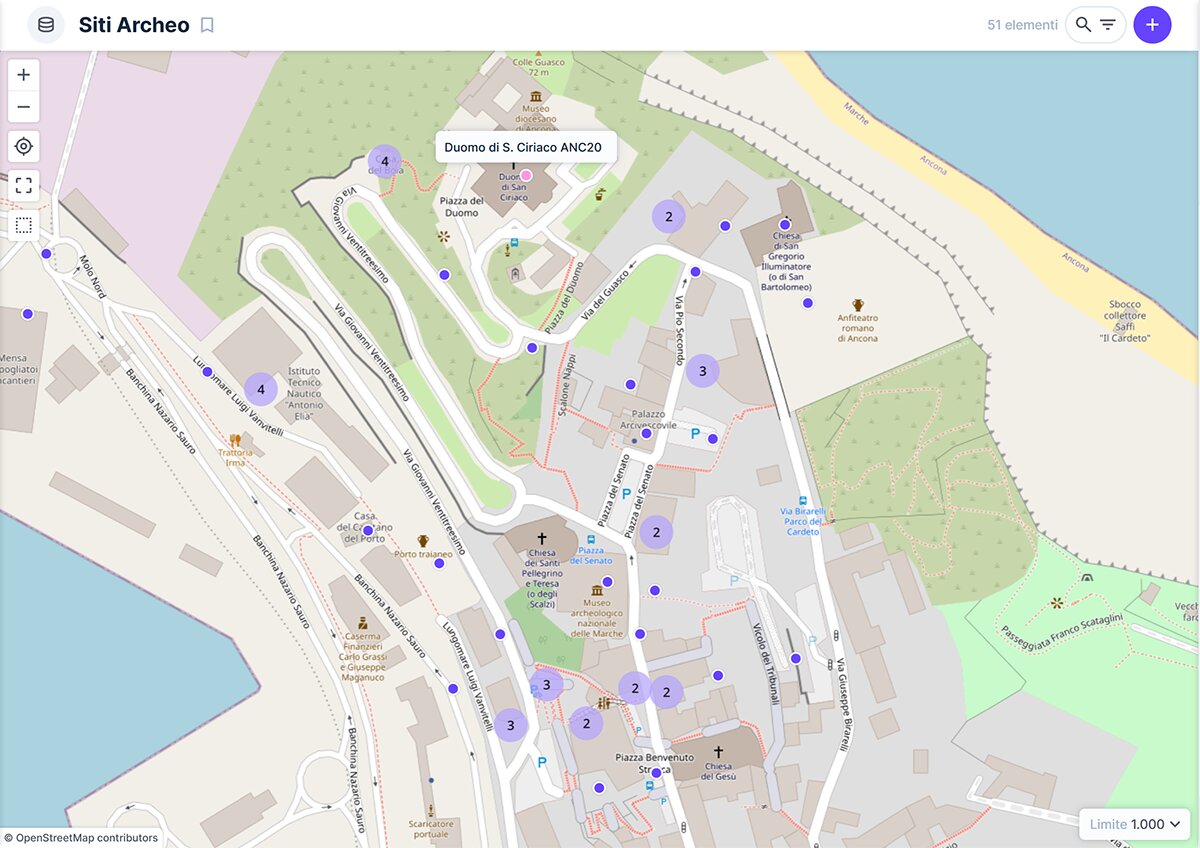
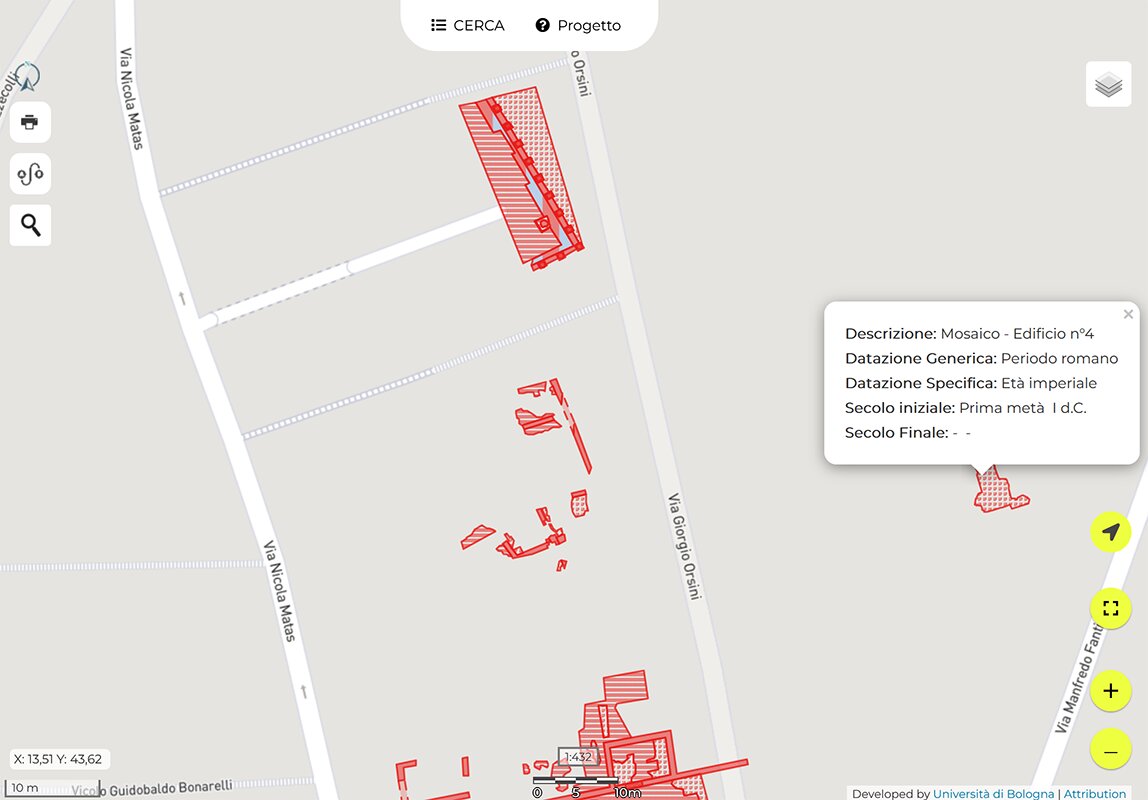
Website and online cartography
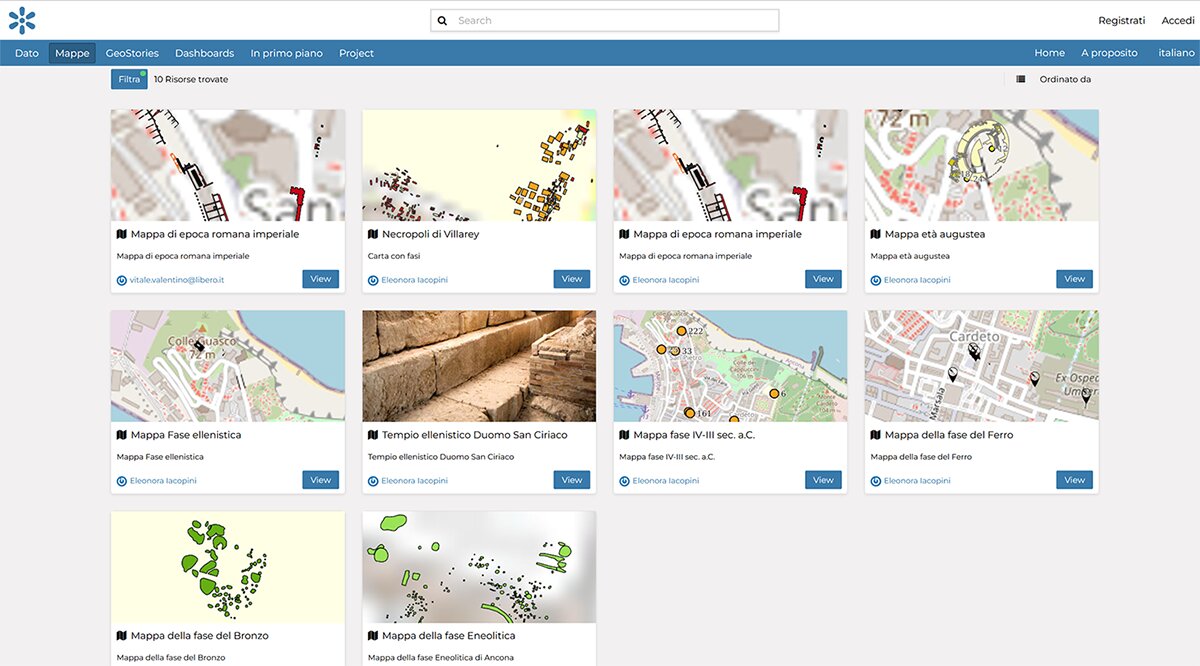
In order to provide open access to all the archaeological sites cards for the general public, a website ( http://archeoancona.cultura.gov.it ) has already been developed. Each card contains various information about the site with a list of relevant documents and drawings downloadable in different formats (CSV, JSON, XLS, and PDF). The “Document Archive” and “Drawing Archive” sections list the individual elements corresponding to archive folders or drawings in tabular format. For each document, the archive (administrative, historical, dossier), protocol number, description, and date are specified. Regarding the drawings, the site’s chronology, inventory number, description, and year of creation are reported. Data downloading is not possible from the public area. From the Web-GIS section, users can access two cartographic versions, one tourist-oriented, developed with the Leaflet JS JavaScript library ( https://leafletjs.com ), allowing precise and planimetric visualization of archaeological sites. In the pinpoint version, the sites are divided into different layers based on general chronology; clicking on the point leads to the site card that can be printed. In the planimetric version, data are distinguished by chronological phases using different colour schemes (e.g., red for the Roman era), and each element is characterised by a specific texture based on what is indicated in the attribute table (M: wall, P: floor, C: channel, etc.). Existing elements are marked with a solid colour, while destroyed/hypothesised ones share the same colour gradient although with a higher degree of transparency. Clicking on each individual element allows users to view its description, such as “polychrome mosaic floor” or “ opus testaceum wall.” In the tourist map, the informational pop-ups only provide a description of the context and do not include all technical information described in the previous section, including excavation details, plans, and administrative files (Figure. 4). This tourist distribution of cartography was already present in the first PuntoZero software and has been preserved in the latest system release. Whereas the use of Geonode v. 4.1 as a geographic platform is an innovation. Compared to the previous version, the most recent one has notable elements of interest for the open access distribution of archaeological data and associated metadata, particularly the ability to upload not only shapefiles but also geopackages to the system. Within Geonode ( https://cartaarcheologica.it ), all shapefiles related to point data and multi-phase floor plans of archaeological sites in Ancona have been uploaded, totaling 105 datasets and 10 maps. Geonode allows the creation of customized maps from datasets uploaded to the system or by adding WMS layers to view data from various sources (Figure. 5). After registering, users can create their maps and add their datasets, a useful feature for technicians as well, who can simply add their work area if they need to check if a public work interferes with archaeological remains. This shared use could benefit both public administrations for urban planning and supervisory bodies, which will gradually build a map of sub-services. Users cannot modify or delete data they do not own, whether maps or datasets; however, they can download and use them. Public visibility of data uploaded by individual users on the portal must be validated by the system administrator; otherwise, data remains for private use. Maps currently in the system relate to the chronological phase visualization of the city of Ancona, from the Eneolithic age to the Imperial Roman era, with a more specific focus on the Villarey necropolis and the Hellenistic temple beneath the Cathedral of San Ciriaco, presenting not only the floor plan but also the entire distribution of elevations relative to the church’s entrance step. The distribution of elevations throughout the city’s territory, distinguished by chronological phases and characteristic elements (threshold, wall crest, floor, etc.), has allowed for the development of soil maps for some areas and the evaluation of archaeological deposit thickness relative to the current surface.Conclusions
The organic and integrated reorganization of archive data and their complete digitization has made it possible to formulate new hypotheses about the urban development of Ancona compared to previous works (Sebastiani 1996) and to assess how the landscape has consequently changed, undergoing significant adaptations both in antiquity and more recently due to the devastating effects of World War II and the 1972 earthquake (X degree on the Mercalli scale).
The exclusive use of open-source software for the complex and heterogeneous management of archive data aims to be an example of entirely free data management, without the need to develop complex home-made or proprietary solutions.
Through the GitHub space of the Digital Archaeology Laboratory of Sapienza (LAD, ), the database structure in SQL format will be shared so that the system can be easily replicated on another Directus installation. At the same time, an explanatory guide to Geonode installation and use is already available on the LAD website ().
References
- Anichini, F., G. Gattiglia, R. Montalbano, A. Rosa Saponara, S. Zanni., 2021, “Analisi delle procedure interne di gestione delle pratiche alle soprintendenze Archeologia, Belle Arti e Paesaggio”. Report by the MAGOH Project (Managing Archaeological data for a sustainable Governance of the Heritage). https://www.mappalab.eu/wp-content/uploads/2021/10/report-1.1_def.pdf
- Bogdani J. 2022. “Archaeological Documentation as a Service. Archaeological Information Systems in the Cloud Era: the Bradypus Case-study.” Archeologia e Calcolatori 33:2, 115-134. [10.19282/ac.33.2.2022.07]
- Bogdani J. 2020. “Defining Methodologies and Protocols for the Use and re-use of Archaeological legacy data. The Case Study of the Archaeological Atlas of Coptic Literature.” In Coptic Literature in Context (4th–13th Cent.): Cultural Landscape, Literary Production, and Manuscript Archaeology edited by P. Buzi, 311-324. Edizioni Quasar: Roma.
- Calandra E., V. Acconcia, V. Boi, A. Falcone, 2021. “Il Geoportale Nazionale per l’Archeologia. Uno strumento per la tutela, la divulgazione e la fruizione del Patrimonio Archeologico italiano.” In Landscapes – Paesaggi culturali, Atti della Giornata di Studi tenutasi a Roma, Museo Nazionale Etrusco di Villa Giulia, il 30 maggio 2019, edited by F. Cambi, D. Mastroianni, V. Nizzo, F. Pignataro, and S. Sanchirico, 353-361. Fondazione Dià Cultura, Roma.
- Calandra E., 2022, “Il Geoportale Nazionale per l’Archeologia.” In L’archeologia preventiva nel quadro del recovery plan, Roma, Accademia dei Lincei, 2022, 71-77.
- Iacopini E., 2023. “Punto Zero, una nuova web application per la gestione e l’informatizzazione dei dati di archivio. Il caso di Ancona.” Archeologia e Calcolatori 34:1, 95-104. [10.19282/ac.34.1.2023.11]
- Iacopini E., 2023. “Punto Zero, una nuova webapp per la gestione, la fruizione e l’archiviazione del patrimonio archeologico di Ancona.” In Landscape 3: Una Sintesi Di Elementi Diacronici: Uomo e Ambiente Nel Mondo Antico: Un Equilibrio Possibile?, edited by F. Carbotti, D. Gangale Risoleo, E. Iacopini, F. Pizzimenti, and I. Raimondo, 211-219. Oxford: Archaeopress. .
- Sebastiani, S. 1996. Ancona: forma e urbanistica. Firenze: L’Erma di Bretschneider.